这篇文章写出来的东西,细节太多了。。。
https://github.com/ParikaGoel/KinectFusion这个库是从Kinect相机中实时的重建环境
https://www.microsoft.com/en-us/research/wp-content/uploads/2016/02/ismar2011.pdf实现的论文。
德国慕尼黑工业大学分享的RGBD数据集。
下面是格式的样子:
1. rgb.txt 和 depth.txt 记录了各文件的采集时间和对应的文件名。
2. rgb/ 和 depth/目录存放着采集到的 png 格式图像文件。彩色图像为八位三通道,深
度图为 16 位单通道图像。文件名即采集时间。
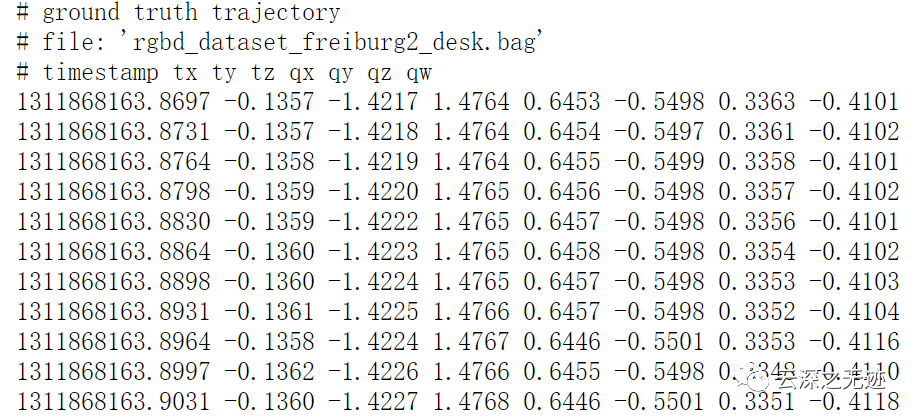
3. groundtruth.txt 为外部运动捕捉系统采集到的相机位姿,格式为
(time, t x , t y , t z , q x , q y , q z , q w ),
https://vision.in.tum.de/data/datasets/rgbd-dataset/download这个链接是全部的数据集下载位置。
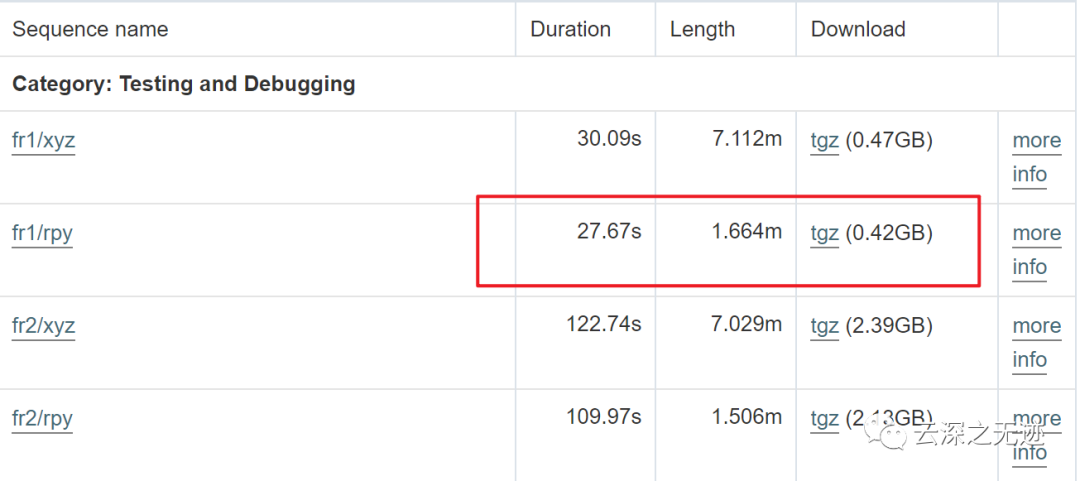
下载一个最小的看看

在下载了
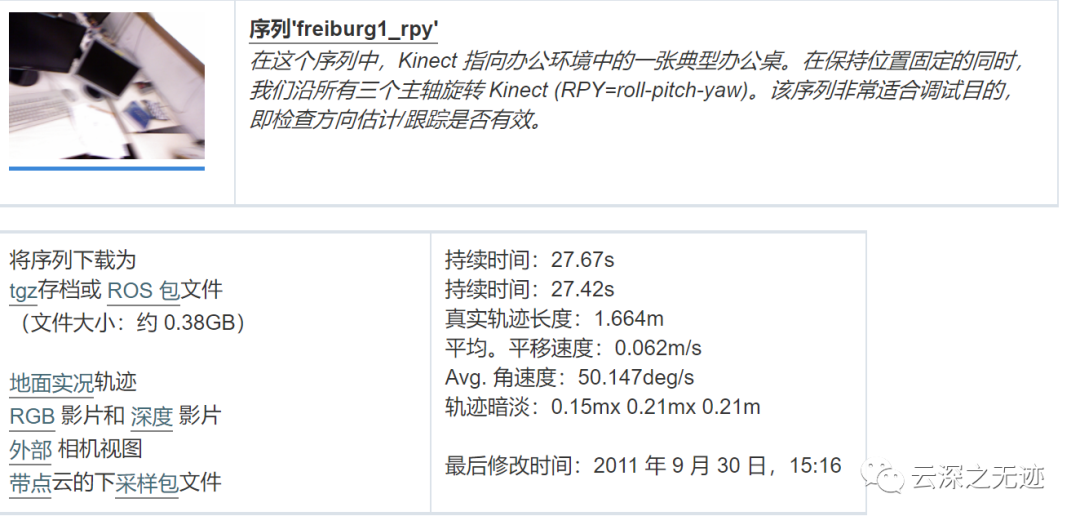
这就是内容

解压以后就是这样的
地面轨迹
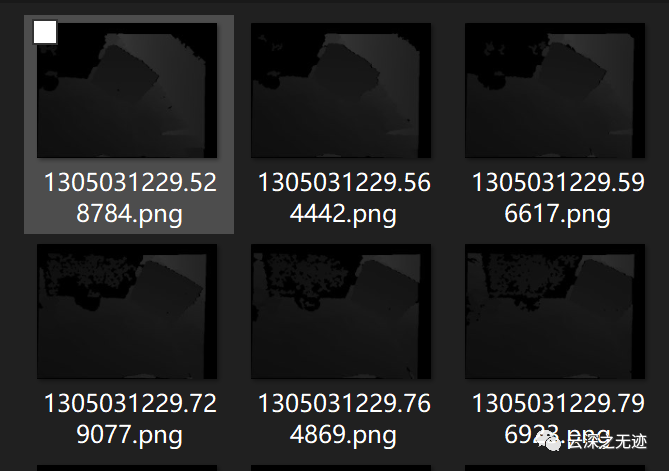
深度图
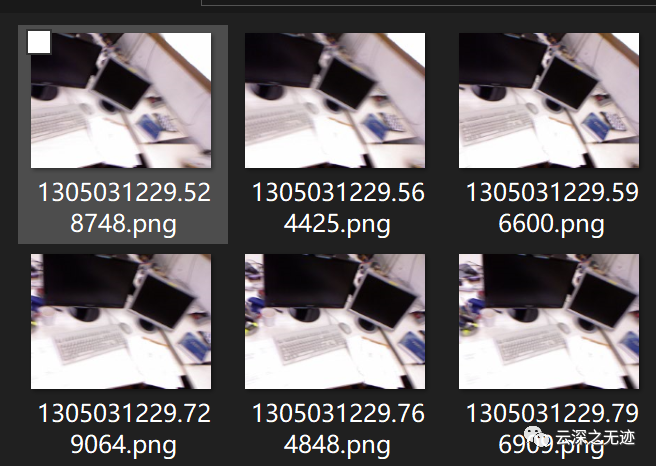
RGB的图
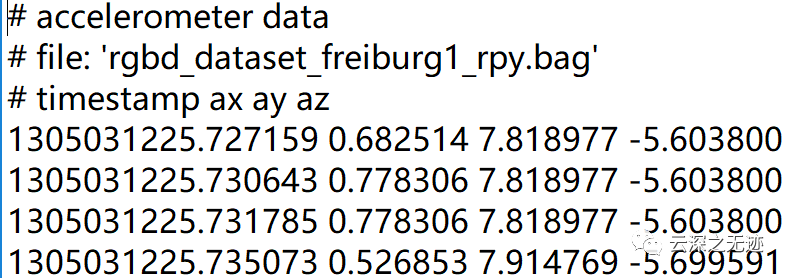
ROSbang的数据,我觉得Intel的工具可以一战
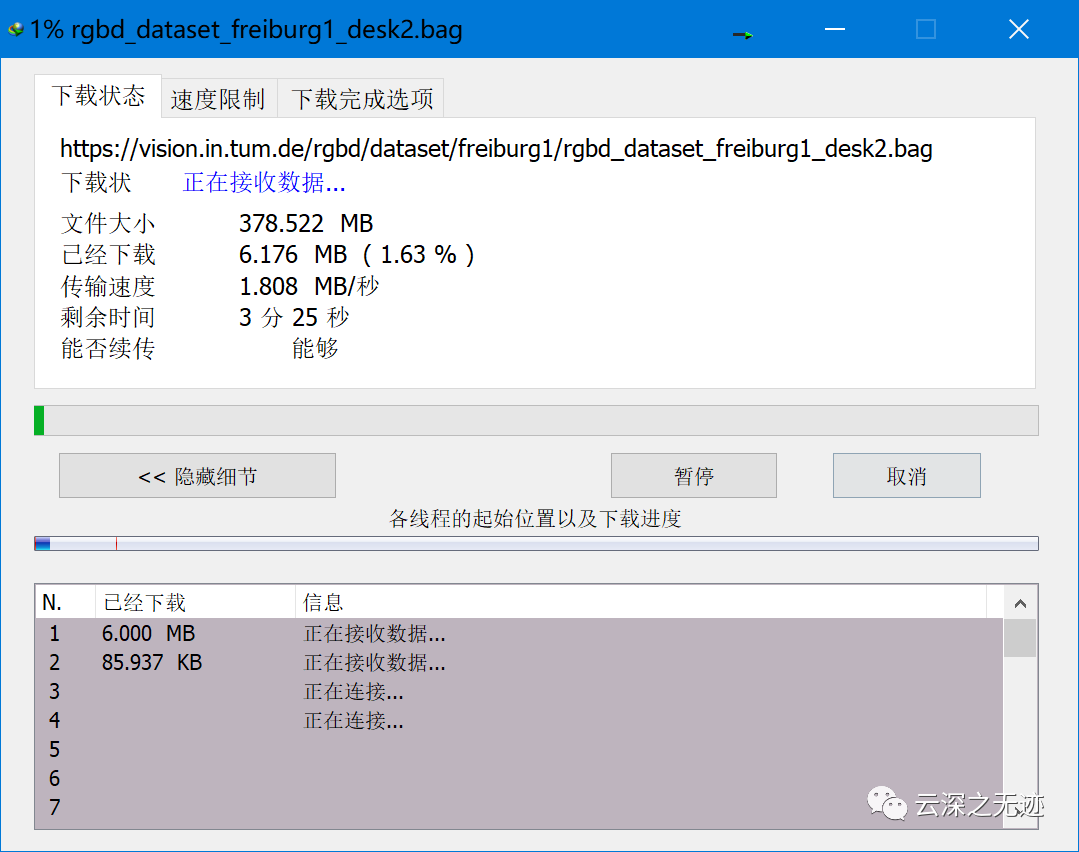
下载下来
ROS 包格式,这是一种用于将 ROS 消息存储在文件中的日志记录格式。使用这种格式的文件称为包,文件扩展名为.bag。包被rosbag和rqt_bag包中的工具记录、回放和一般操作。
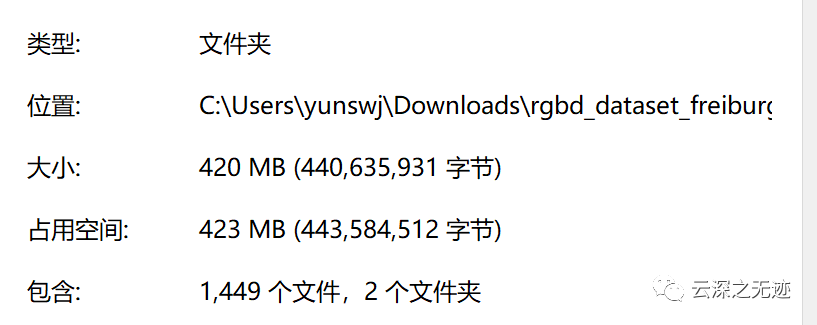
解压后的文件
彩色图像以 PNG 格式存储为 640x480 8 位 RGB 图像。
深度图以 PNG 格式存储为 640x480 16 位单色图像。
颜色和深度图像已经使用 PrimeSense 的 OpenNI 驱动程序预先注册,即颜色和深度图像中的像素已经 1:1 对应。
深度图像按5000的因子进行缩放,即深度图像中5000的像素值对应距离相机1米,10000到2米距离等。像素值为0表示缺失值/没有数据。
已经被处理过了
将真实轨迹作为文本文件提供,其中包含相机在固定坐标系中的平移和方向
文本文件中的每一行都包含一个姿势。
每行的格式为' timestamp tx ty tz qx qy qz qw '
时间戳(浮点数)给出自 Unix 纪元以来的秒数。
tx ty tz (3 个浮点数) 给出彩色相机的光学中心相对于运动捕捉系统定义的世界原点的位置。
qx qy qz qw(4 个浮点数)以单位四元数的形式给出彩色相机的光学中心相对于运动捕捉系统定义的世界原点的方向。
该文件可能包含必须以“#”开头的注释。
从 2D 图像到 3D 点云的转换工作如下。请注意,每个相机的焦距 (fx/fy)、光学中心 (cx/cy)、畸变参数 (d0-d4) 和深度校正因子都不同。
下面的 Python 代码说明了如何根据像素坐标和深度值计算 3D 点:
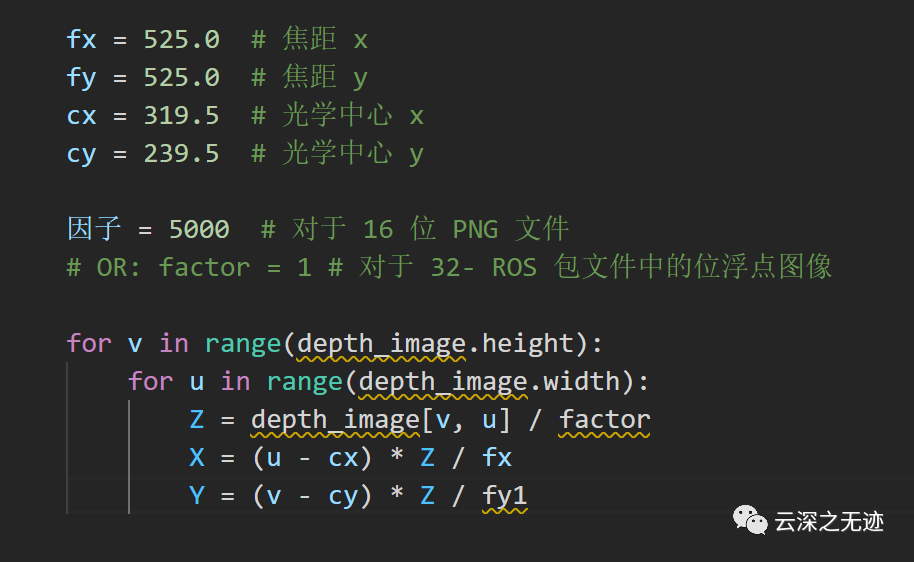
中文的注释
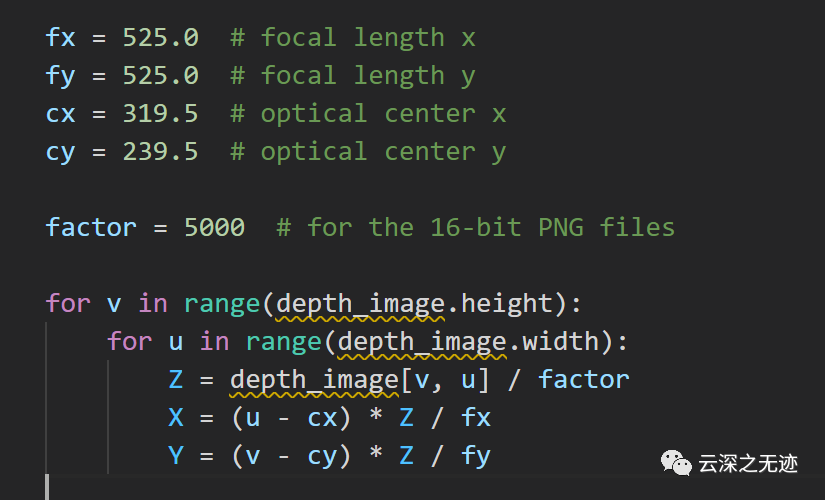
英文
https://dev.intelrealsense.com/docsIntelrealsense的文档
https://github.com/IntelRealSense/librealsense/releases在这里下载播放工具

这么大
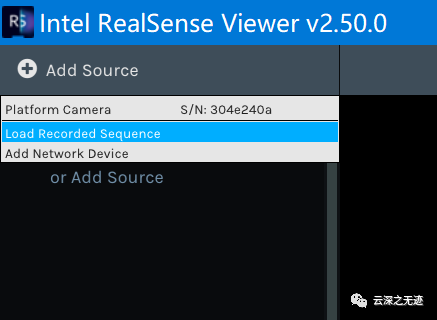
插我的R200没有反应,bang也读取不了
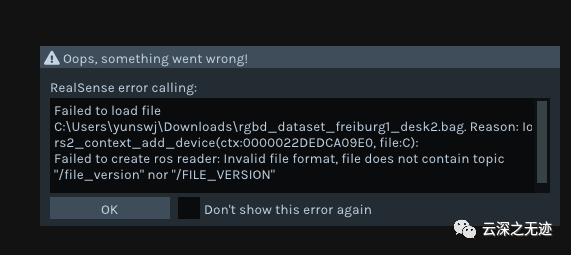
ROS包出错
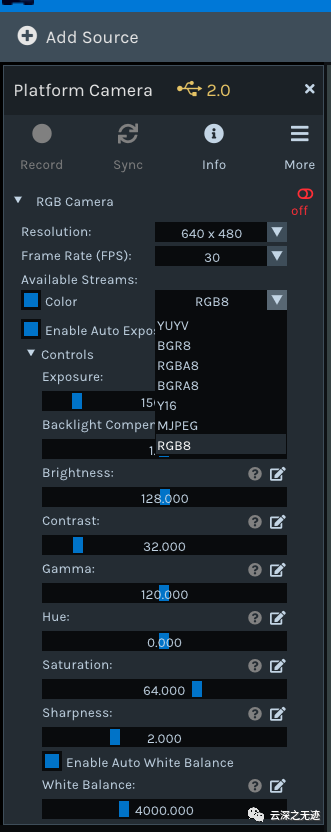
但是会识别自带的摄像头,所以RealSense的相机也是UVC的驱动
https://www.mrpt.org/tutorials/programming/maths-and-geometry/2d_3d_geometry/在惆怅之余,找到一个可以学习数学知识的链接:
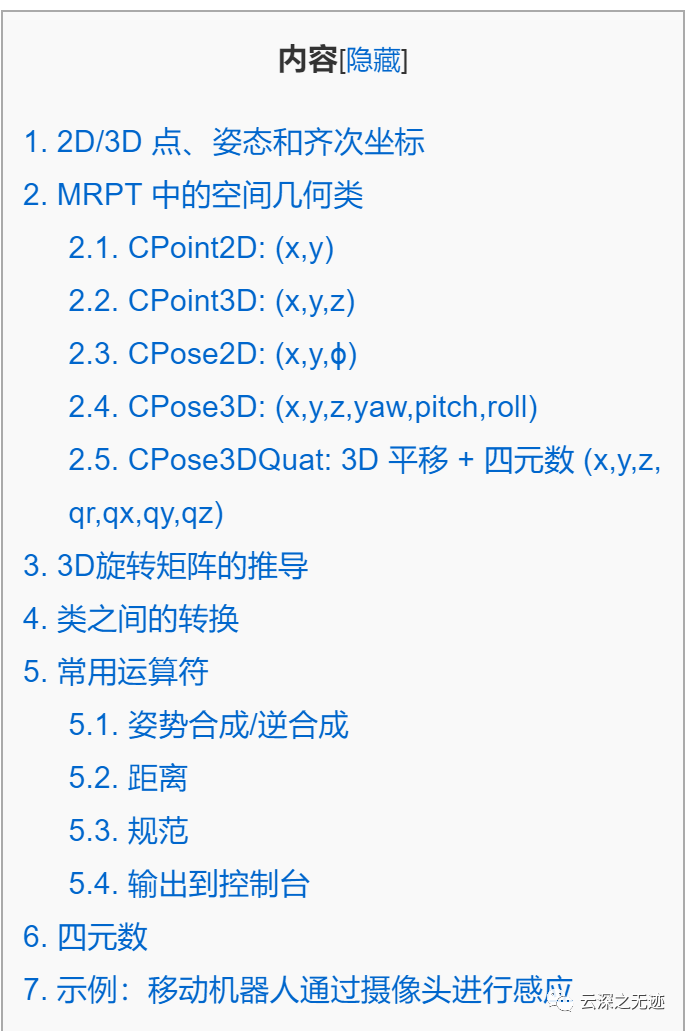
当然是不问因果的学
https://svncvpr.in.tum.de/cvpr-ros-pkg/trunk/rgbd_benchmark/rgbd_benchmark_tools/src/rgbd_benchmark_tools/这个地址里面是一些关于处理RGBD的PY脚本。
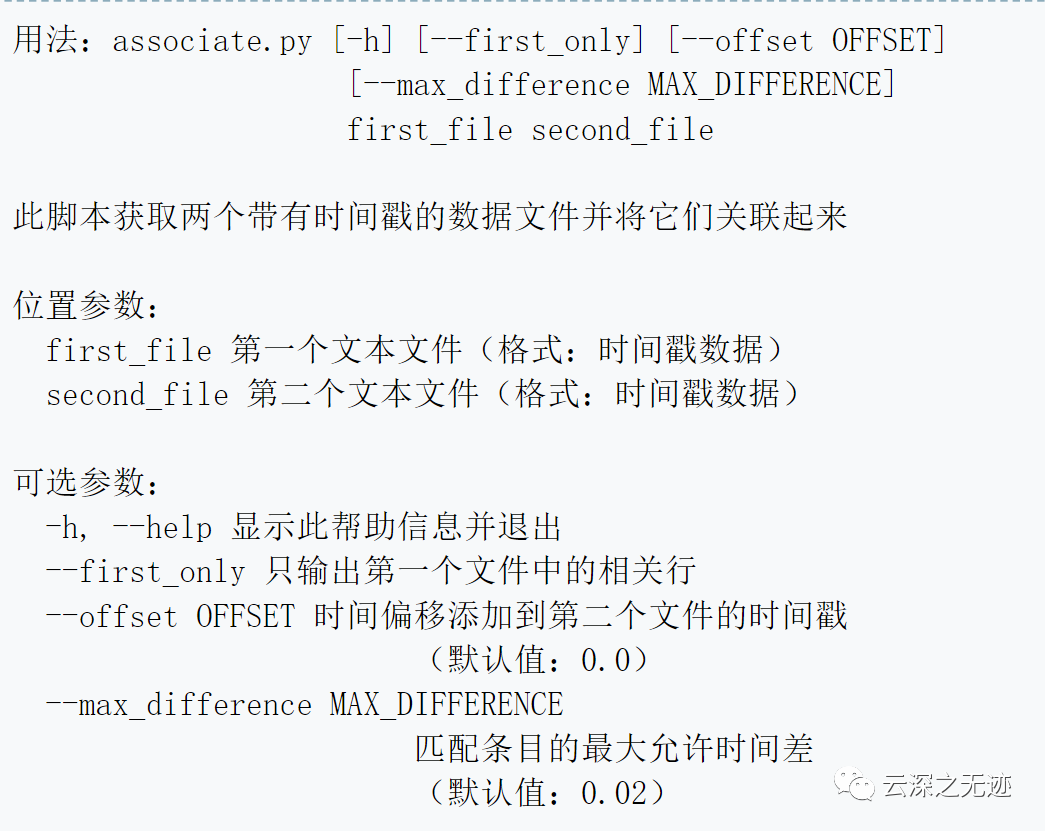
Kinect 以不同步的方式提供颜色和深度图像。这意味着来自彩色图像的时间戳集与深度图像的时间戳不相交。因此,我们需要某种方式将彩色图像与深度图像相关联。
import argparseimport sysimport osimport numpydef read_file_list(filename):"""Reads a trajectory from a text file.File format:The file format is "stamp d1 d2 d3 ...", where stamp denotes the time stamp (to be matched)and "d1 d2 d3.." is arbitary data (e.g., a 3D position and 3D orientation) associated to this timestamp.Input:filename -- File nameOutput:dict -- dictionary of (stamp,data) tuples"""file = open(filename)data = file.read()lines = data.replace(",", " ").replace("\t", " ").split("\n")list = [[v.strip() for v in line.split(" ") if v.strip() != ""]for line in lines if len(line) > 0 and line[0] != "#"]list = [(float(l[0]), l[1:]) for l in list if len(l) > 1]return dict(list)def associate(first_list, second_list, offset, max_difference):"""Associate two dictionaries of (stamp,data). As the time stamps never match exactly, we aimto find the closest match for every input tuple.Input:first_list -- first dictionary of (stamp,data) tuplessecond_list -- second dictionary of (stamp,data) tuplesoffset -- time offset between both dictionaries (e.g., to model the delay between the sensors)max_difference -- search radius for candidate generationOutput:matches -- list of matched tuples ((stamp1,data1),(stamp2,data2))"""first_keys = first_list.keys()second_keys = second_list.keys()potential_matches = [(abs(a - (b + offset)), a, b)for a in first_keysfor b in second_keysif abs(a - (b + offset)) < max_difference]potential_matches.sort()matches = []for diff, a, b in potential_matches:if a in first_keys and b in second_keys:first_keys.remove(a)second_keys.remove(b)matches.append((a, b))matches.sort()return matchesif __name__ == '__main__':# parse command lineparser = argparse.ArgumentParser(description='''This script takes two data files with timestamps and associates them''')parser.add_argument('first_file', help='first text file (format: timestamp data)')parser.add_argument('second_file', help='second text file (format: timestamp data)')parser.add_argument('--first_only', help='only output associated lines from first file', action='store_true')parser.add_argument('--offset', help='time offset added to the timestamps of the second file (default: 0.0)', default=0.0)parser.add_argument('--max_difference', help='maximally allowed time difference for matching entries (default: 0.02)', default=0.02)args = parser.parse_args()first_list = read_file_list(args.first_file)second_list = read_file_list(args.second_file)matches = associate(first_list, second_list, float(args.offset), float(args.max_difference))if args.first_only:for a, b in matches:print("%f %s" % (a, " ".join(first_list[a])))else:for a, b in matches:print("%f %s %f %s" % (a, " ".join(first_list[a]), b-float(args.offset), " ".join(second_list[b])))
配准代码
深度图像已经与彩色图像配准,因此深度图像中的像素已经与彩色图像中的像素一一对应。因此,生成彩色点云很简单。
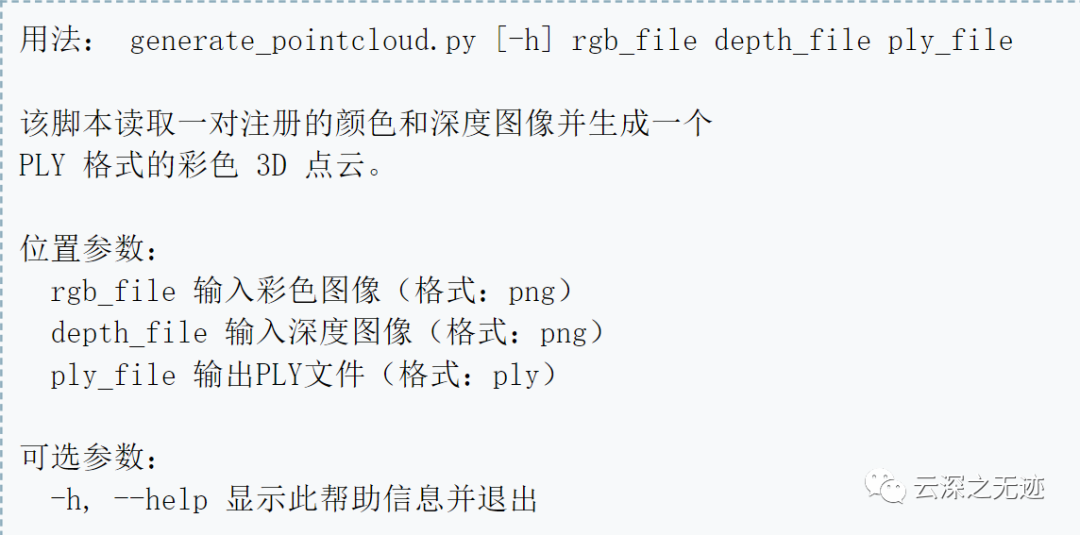
脚本使用方法
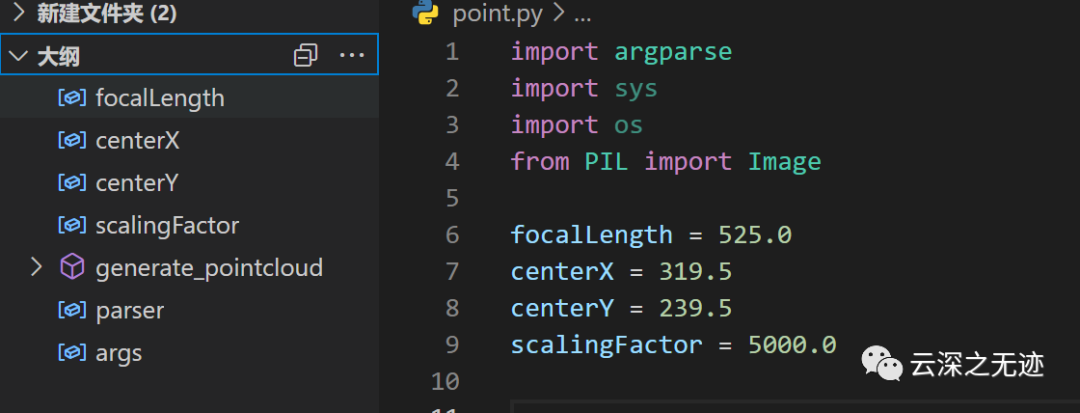
就一个函数
以上都可以从:
https://svncvpr.in.tum.de/cvpr-ros-pkg/trunk/rgbd_benchmark/rgbd_benchmark_tools/src/rgbd_benchmark_tools/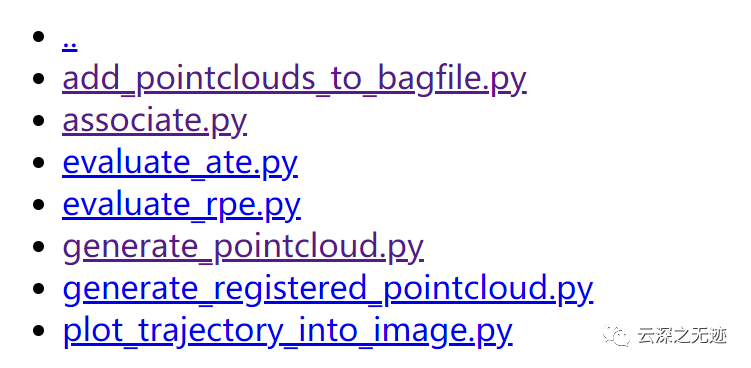
获得
https://vision.in.tum.de/data/datasets/rgbd-dataset/tools#evaluation这些是文档:
怎么说呢,就是RGB和深度的图像采集回来以后,要进行一步融合操作,就好像是组装,在一张图像里面写入更多的信息。
接着按照规矩是对融合后的成果进行评价,但是这里就不加这步了。接着就可以做高层的点云展示啥的。
反正我也是给搞研究,这里就插点如何生成点云的算法操作,注意是一个rgb和图和一个深度图,生成一个点云图。
格式上面是:png+png=PLY format
最后这个格式,我最后补格式要求

做实验前,先准备一下
由于RGB和Depth是一一对应的关系,所以分辨率是一样的。深度图像 = 普通RGB三通道彩色图像 + Depth Map。
包含与视点场景对象表面距离有关信息的图像通道,通道本身类似于灰度图像,每个像素值是传感器测出距离物体的实际距离

分类
与相机距离成比例:较近的表面较暗; 其他表面较轻
与标称平面的距离相关:靠近焦平面的表面较暗; 远离焦平面的表面更轻
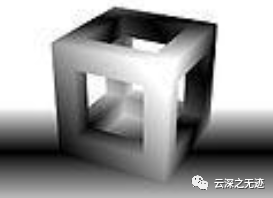

其实这个图是来自于一本书中
用深度相机获取到了深度图depth map,相当于黑白图像有两个通道,灰度值和深度值,彩色图像有四个通道RGBD。
图像深度 是指存储每个像素所用的位数,也用于量度图像的色彩分辨率。
图像深度 确定彩色图像的每个像素可能有的颜色数,或者确定灰度图像的每个像素可能有的灰度级数。它决定了彩色图像中可出现的最多颜色数,或灰度图像中的最大灰度等级。比如一幅单色图像,若每个像素有8位,则最大灰度数目为2的8次方,即256。一幅彩色图像RGB三通道的像素位数分别为4,4,2,则最大颜色数目为2的4+4+2次方,即1024,就是说像素的深度为10位,每个像素可以是1024种颜色中的一种。
例如:
一幅画的尺寸是1024*768,深度为16,则它的数据量为1.5M。
计算如下:
1024×768×16bit =(1024×768×16)/8 Byte =[(1024×768×16)/8]/1024 KB =1536 KB ={[(1024×768×16)/8]/1024}/1024 MB= 1.5 MB

一个函数就完事了
“”“”“”是Python的说明文档,说了输入和输出
下面是使用了Image的打开方法

PIL库的方法

这里可以看作是处理前的准备,一定要保证分辨率的一致,我写个脚本验证一下。
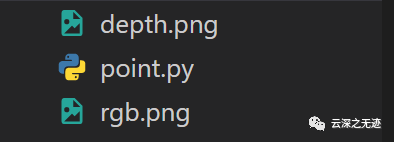
这里先改名字
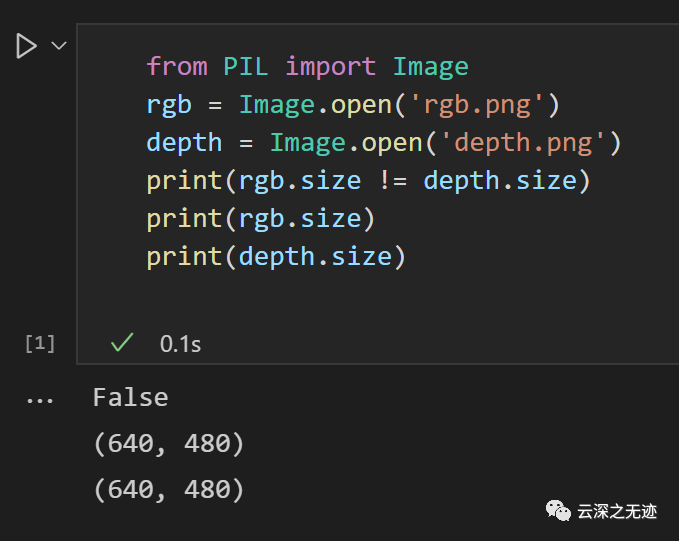
写脚本验证一下
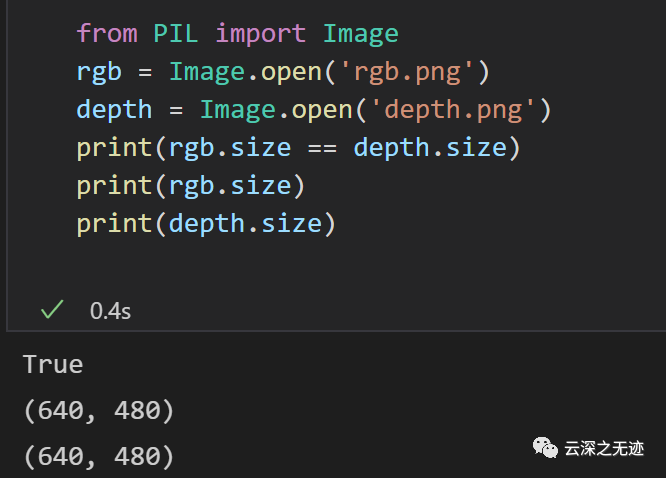
都一样的
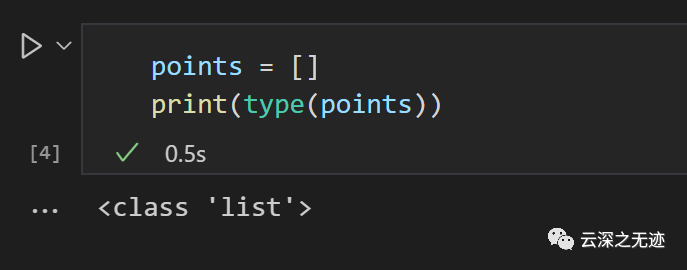
接着使用一个列表来放我们的点云数据
focalLength = 525.0centerX = 319.5centerY = 239.5scalingFactor = 5000.0
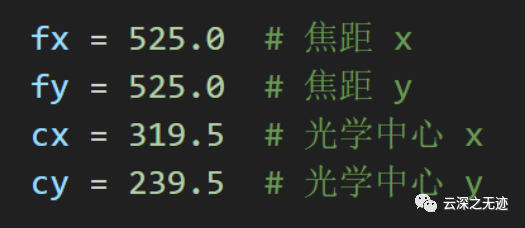
4参数
深度图像按5000的因子进行缩放,即深度图像中5000的像素值对应距离相机1米,10000到2米距离等。
像素值为0表示缺失值/没有数据。
16bit的png是5000
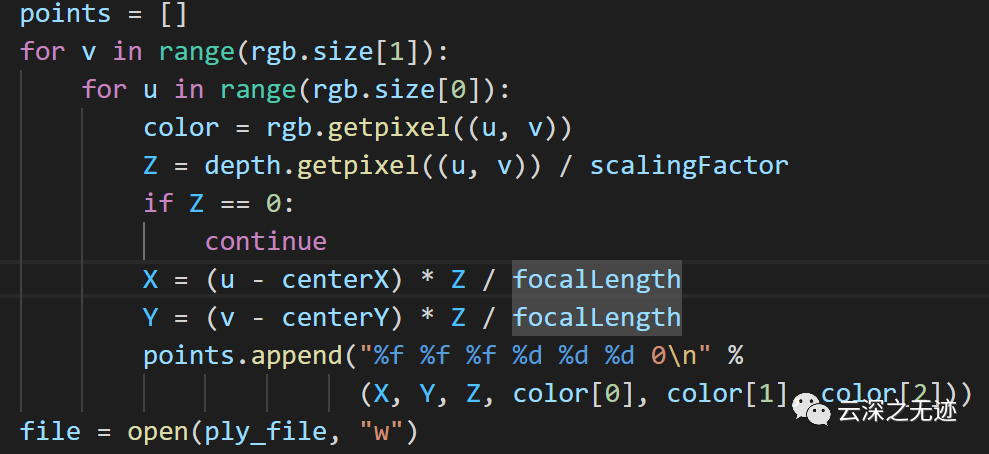
这句是我们的精华
某点像素坐标(u , v)及其对应深度值depth,根据相机参数以及以下公式,可以求得该点的相机坐标(x , y , z)为
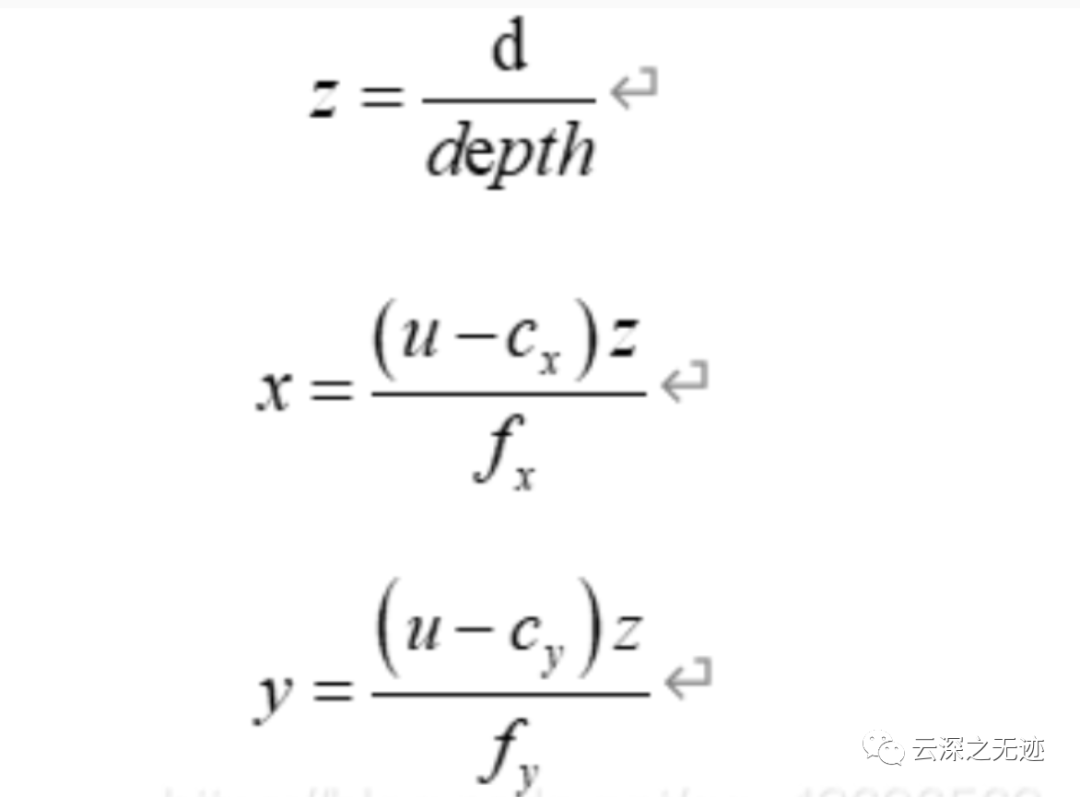
def depth2mi(depthValue):return depthValue * 0.001def depth2xyz(u, v, depthValue):fx = 361.1027fy = 361.8266cx = 258.4545cy = 212.1282depth = depth2mi(depthValue)z = float(depth)x = float((u - cx) * z) / fxy = float((v - cy) * z) / fyresult = [x, y, z]return result
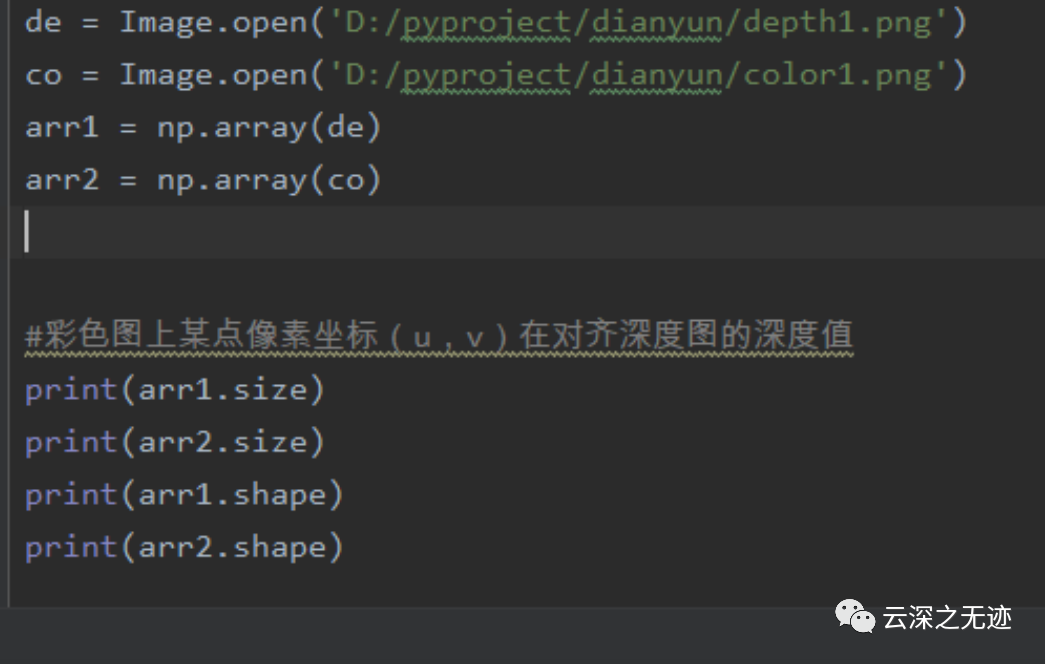
#深度图存入np数组arr = np.array(depth)#彩色图上某点像素坐标(u,v)在对齐深度图的深度值depthValue =float(arr3[v, u])coordinate = depth2xyz(u, v, depthValue)
上面是另一种实现。
然后我们讲算法?不~我们去看PIL
