同步发布到个人公众号:电子技术攻城狮-树莓派ADC
本文介绍在树莓派上使用python和qt开发一个显示ADC数据的GUI程序。开发环境使用PyCharm进行python代码远程开发,然后使用QtCreator编写QML界面。
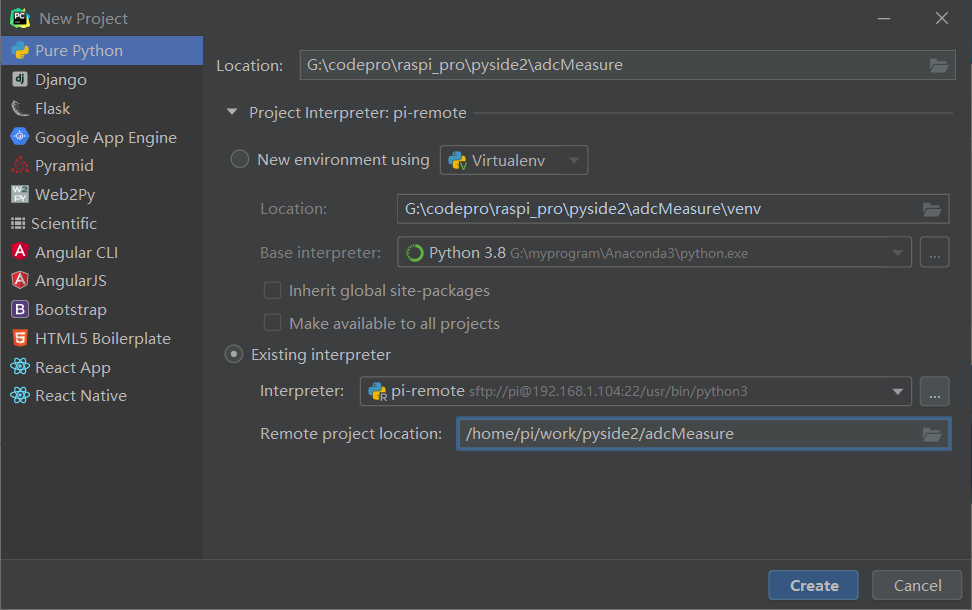
打开PyCharm,新建工程adcMeasure,如下:

adcMeasure.py 主程序如下:
import os
import sys
from pathlib import Path

from PySide2.QtCore import Qt, QObject, Slot
from PySide2.QtQml import QQmlApplicationEngine
from PySide2.QtWidgets import QApplication

from adc_mcp3424 import MCP3424


class Controler(QObject):
    def __init__(self):
        super().__init__()

        self.MCP3424 = MCP3424(6, address=0x68, rate=18)

    @Slot()
    def exit(self):
        sys.exit()

    @Slot(result=float)
    def get_adc1(self):
        adc1 = self.MCP3424.read_raw(1)
        adc1 = adc1/100.00
        # print("adc1:",adc1)
        return adc1

......


if __name__=='__main__':
    a = QApplication(sys.argv)
    a.setOverrideCursor(Qt.BlankCursor)

    engine = QQmlApplicationEngine()

    controler = Controler()
    context = engine.rootContext()
    context.setContextProperty("_Controler", controler)

    engine.load(os.fspath(Path(__file__).resolve().parent / "ui/adcMeasure.qml"))

    if not engine.rootObjects():
        sys.exit(-1)

    sys.exit(a.exec_())
程序中新建一个Controler类,用于获取ADC数值,并将ADC值传递到GUI界面进行显示。
import QtQuick 2.11
import QtQuick.Window 2.4
import QtQuick.Controls 2.4
import QtQuick.Controls.Styles 1.4
import QtQuick.Extras 1.4
import QtGraphicalEffects 1.0
import QtCharts 2.2

ApplicationWindow{
    id:root
    width: 800
    height: 480
    visible: true
//    visibility: Window.FullScreen

    background: Rectangle{
        anchors.fill: parent
        color: "#101010"
    }

    Button{
        id:btnexit
        background: Rectangle{
            color: "#a01010"
            anchors.fill: parent
            radius:12
        }
        width: 48
        height: 48
        anchors{
            top: parent.top
            right: parent.right
            topMargin: 8
            rightMargin: 8
        }
        Text {
            text: qsTr("X")
            anchors.centerIn: parent
            font{
                pointSize: 32
            }
            color: "white"
        }
        onClicked: {
            _Controler.exit();
        }
    }

    Text {
        id: title
        text: qsTr("ADC Measure")
        anchors{
            top:  parent.top
            horizontalCenter: parent.horizontalCenter
            topMargin: 20
        }
        font{
            pointSize: 24
        }
        color: "#a0a0a0"
    }

    ChartView{
        id:cv
        width:600
        height:400

        anchors{
            top:title.bottom
            topMargin:10
            left:parent.left
            leftMargin:40
        }
        antialiasing: true
        theme: ChartView.ChartThemeDark

        property int  timcnt: 0
        property double  valueCH1: 0
        property double  valueCH2: 0
        property double  valueCH3: 0
        property double  valueCH4: 0

        ValueAxis{
            id:xAxis
            min: cv.timcnt < 10 ? 0 : cv.timcnt - 10 max: cv.timcnt < 10 ? 10 : cv.timcnt + 1 tickCount: 11 labelFormat: "%d" } ValueAxis{ id:yAxis min: 0 max: 500 tickCount: 1 labelFormat: "%d" } LineSeries { name: "CH1" id:lines1 axisX: xAxis axisY: yAxis width: 3 color: "#1267D4" } LineSeries { name: "CH2" id:lines2 axisX: xAxis axisY: yAxis width: 3 color: "#8D7A1F" } LineSeries { name: "CH3" id:lines3 axisX: xAxis axisY: yAxis width: 3 color: "#8A1E1D" } LineSeries { name: "CH4" id:lines4 axisX: xAxis axisY: yAxis width: 3 color: "#C21FE4" } Timer{ id:tm interval: 1000 repeat: true running: true onTriggered: { cv.timcnt = cv.timcnt + 1 cv.valueCH1 = _Controler.get_adc1() cv.valueCH2 = _Controler.get_adc2() cv.valueCH3 = _Controler.get_adc3() cv.valueCH4 = _Controler.get_adc4() lines1.append(cv.timcnt,cv.valueCH1) lines2.append(cv.timcnt,cv.valueCH2) lines3.append(cv.timcnt,cv.valueCH3) lines4.append(cv.timcnt,cv.valueCH4) console.log("--------------------") console.log("qml adc value1:",cv.valueCH1) console.log("qml adc value2:",cv.valueCH2) console.log("qml adc value3:",cv.valueCH3) console.log("qml adc value4:",cv.valueCH4) } } } }
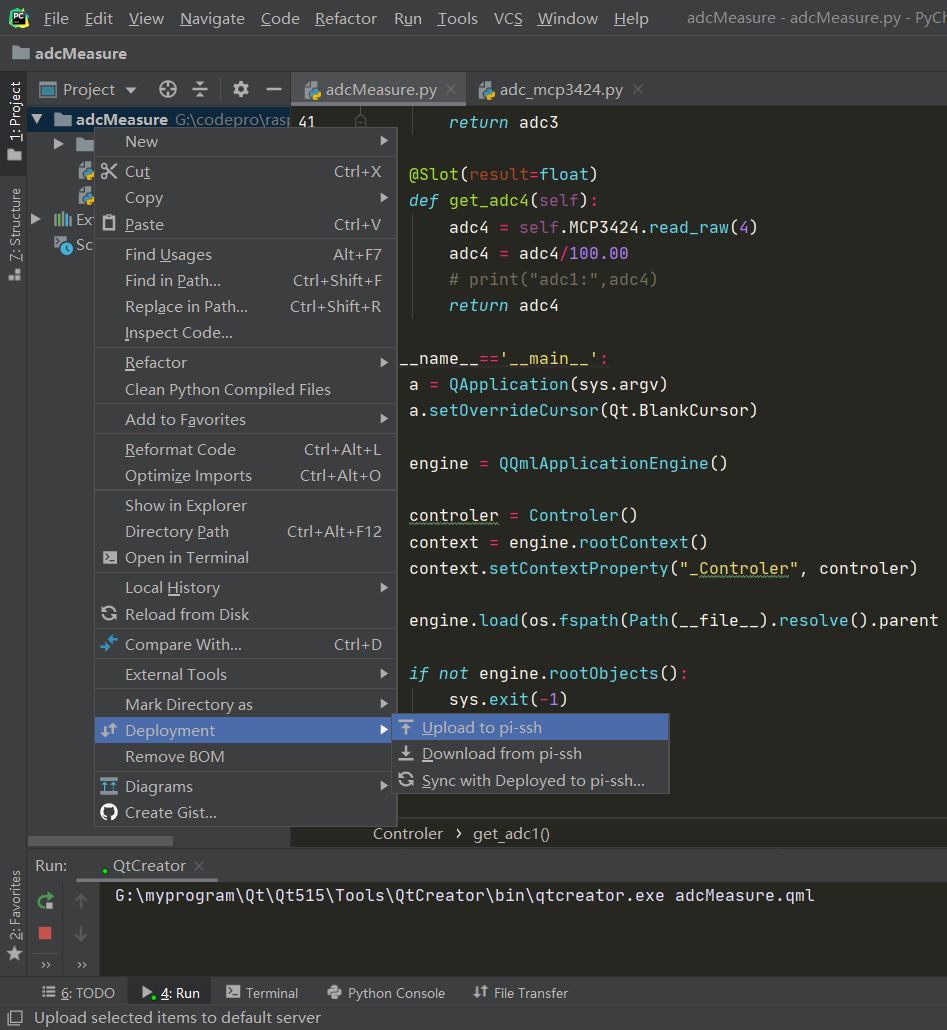
在工程上右键将这个项目文件上传到树莓派中:

树莓派连接一个I2C接口的ADC模块,这里使用的是MCP3424,它拥有四通道最大18位的精度。将四个可调变阻器连接到ADC四个通道上,这样通过调节电阻来测试变化的模拟值。
上传后,在树莓派对应文件夹中,执行如下命令执行程序:
python3 adcMeasure.py
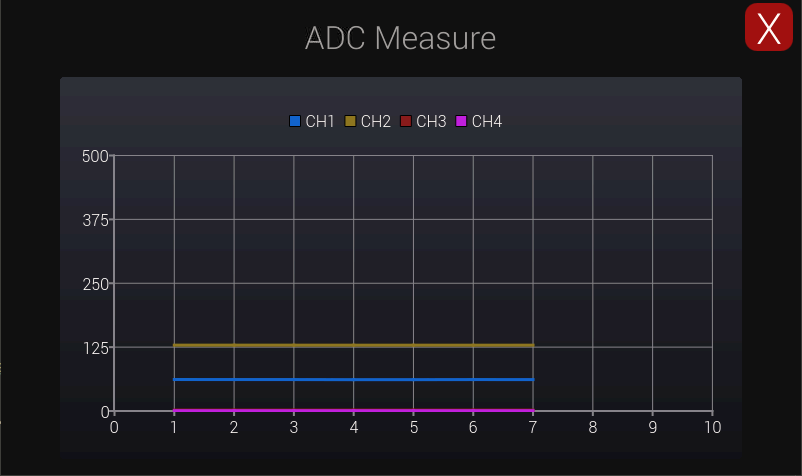
执行后可以看到显示如下:

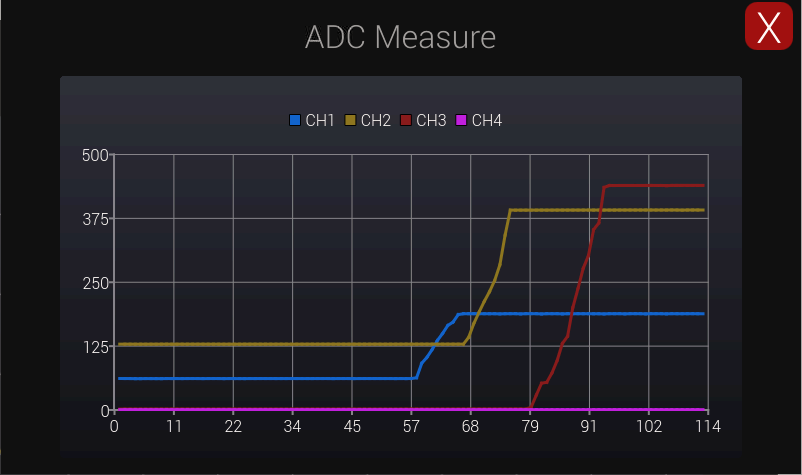
当调节电阻时候,可以看到其变化曲线:

完整代码: