这文章适合在电脑上面看,手机屏幕太小了
今天绘图,好多忘记了,然后参考了一篇文章,整理一份复习资料出来:
plot(x, y, linestyle, linewidth, marker, markersize, color, alpha)
线的风格
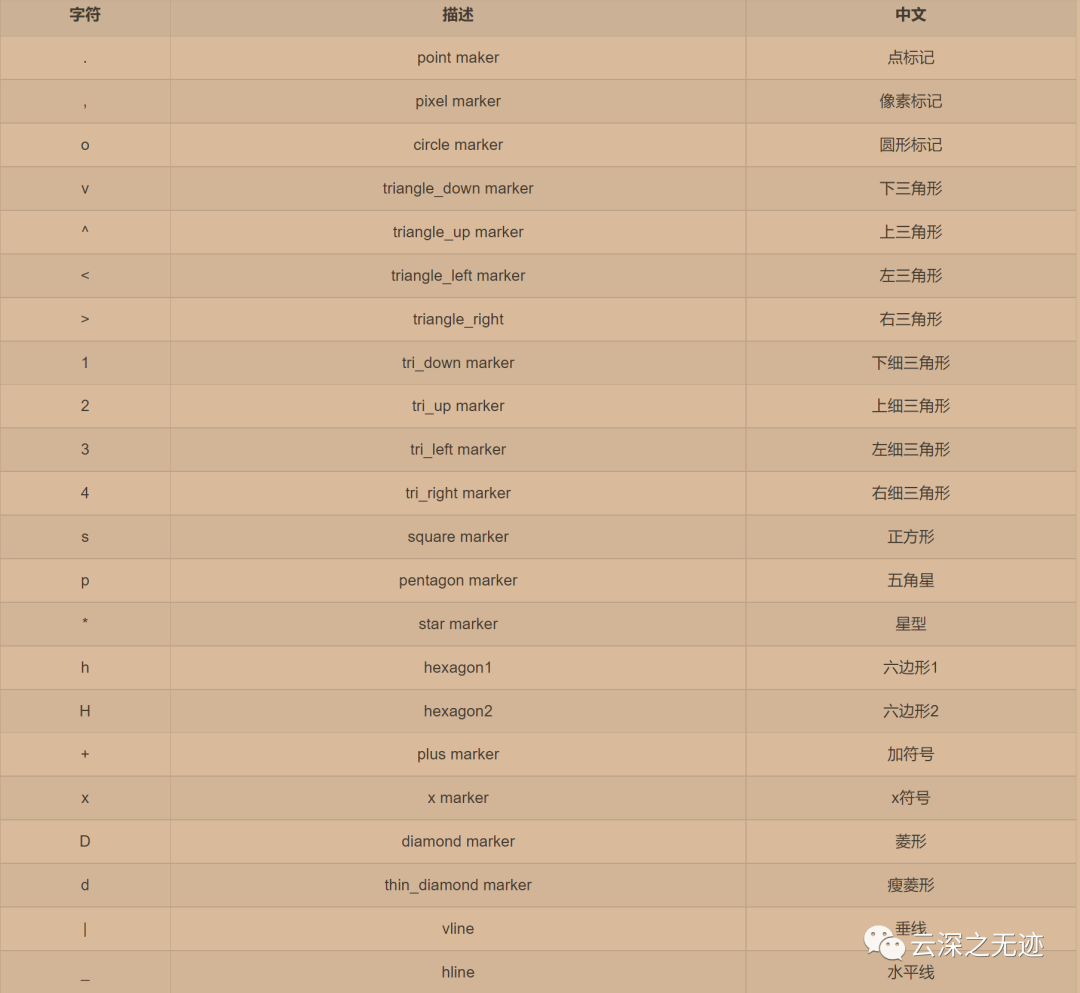
标记点的样子
plot(x, y, linestyle, linewidth, marker, markersize, color, alpha)x就是每次取的步进值
y是计算表达式后的值
线的风格
线宽
上面点的样子
这个形状的大小
颜色
透明度[0,1] 左闭右闭
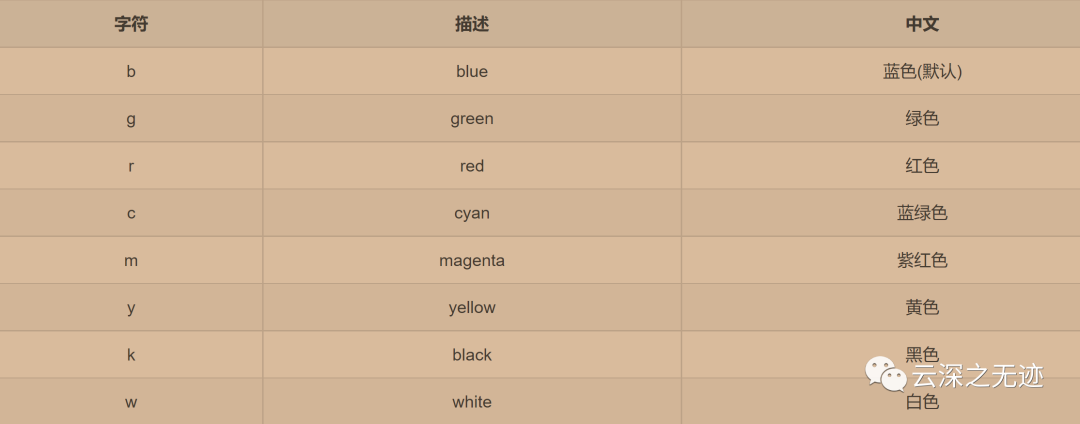
颜色表
对于一个颜色有很多的输入:
red r 这样的写法是可以的
16进制的串串是可以的 “#008000”
RGBA - (Red, Green, Blue, Alpha)
RGBA 值在 0-1 之间
color = (0.3, 0.5, 0.7, 0.9) 写法
plot(x, y, fmt)这样也是可以的
fmt = [color] [marker] [linestyle]fmt里面写这个
b --- blue markers with default shapero --- red circlesg- --- green solid line-- --- dashed line with default color
就是这样
b --- 默认形状的蓝色标记ro --- 红色圆圈g- --- 绿色实线--- 默认颜色的虚线
我帮你翻译了
对一个图来说,坐标轴很重要:
xlabel(xlabel, fontproporties=None, fontsize=12, rotation=0, backgroundcolor='b', color='k', alpha=None, bbox=None)ylabel(ylabel, fontproporties=None, fontsize=12, rotation=90, backgroundcolor='b', color='k', alpha=None, bbox=None)
调用方式
xlabel --- 标签。
fontproporties --- 字体路径,默认None。(注意:font设置后,fontdict部分属性失效)
fontsize --- 字体大小,默认12
rotation --- 旋转角度,从0开始。ylabel默认90,即垂直;xlabel默认0,即水平。
backgroundcolor--- 背景色。
color --- 标签颜色。
alpha --- 字体透明度。取值[0,1]。
(2)fontdict ---字体字典参数(key加引号),包含font属性"fontsize":12 --- 字体大小,默认12。整型"fontweight":"medium" --- 字体粗细。可选:'light', 'normal', 'medium', 'semibold', 'bold', 'heavy', 'black'"fontstyle":"normal" --- 字体风格。可选:"normal", "italic"-斜体, "oblique"-倾斜"verticalalignment":"baseline" --- 设置垂直对齐方式。可选:"center", "bottom", "top", "baseline""horizontalalignment":"center" --- 设置水平对齐方式。可选:"left","right","center"
参数
xlabel(xlabel, fontproporties=None)字典参数
(3)bbox ---设置标题盒属性字典参数(key不加引号)boxstyle --- 设置边框风格。如:"round"facecolor --- fc。设置标题框背景颜色。edgecolor --- ec。设置边框颜色。linewidth --- lw。设置边框厚度。alpha --- 设置背景透明度
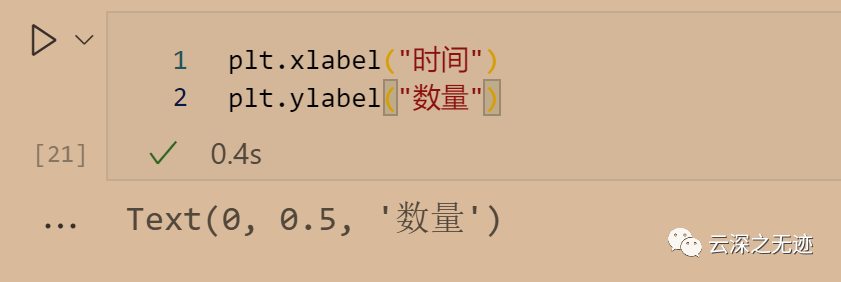
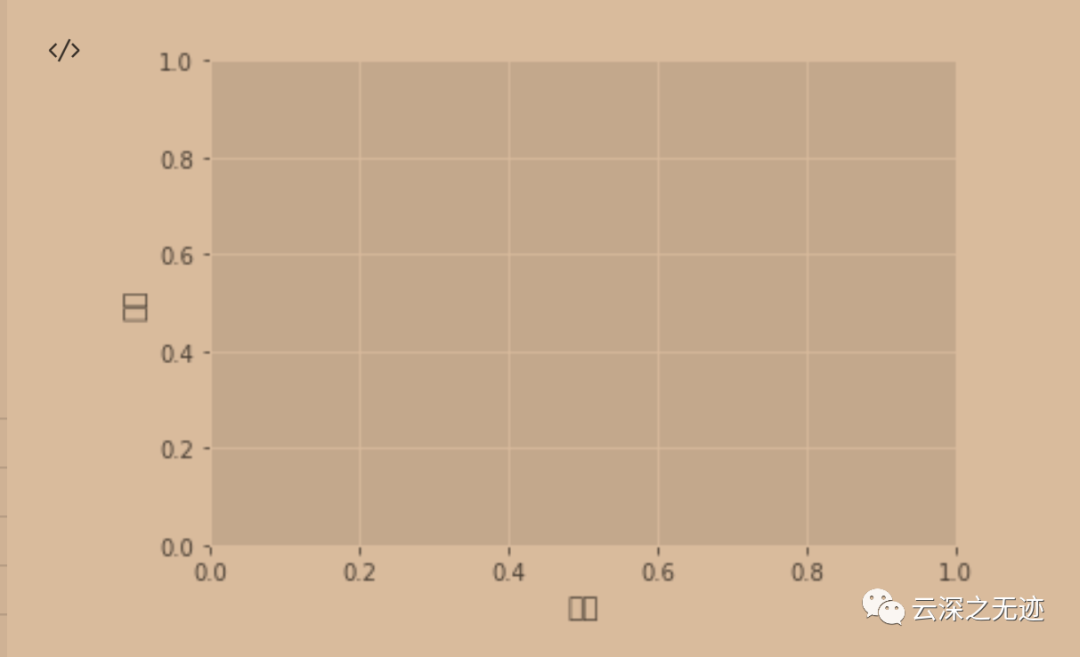
可以看到中文,显示异常
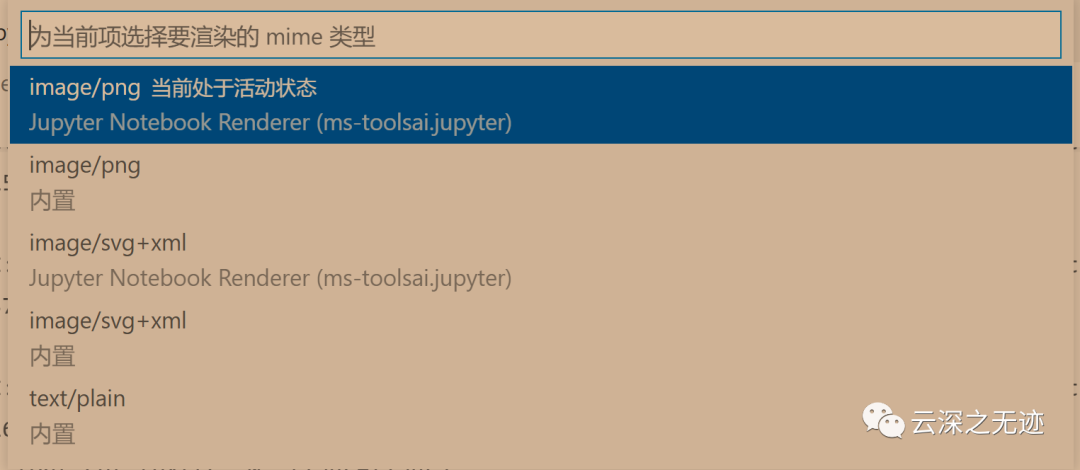
VSCode里面可以选渲染的引擎
plt.xlabel("时间")plt.ylabel("数量")plt.rcParams['font.sans-serif']=['SimHei']
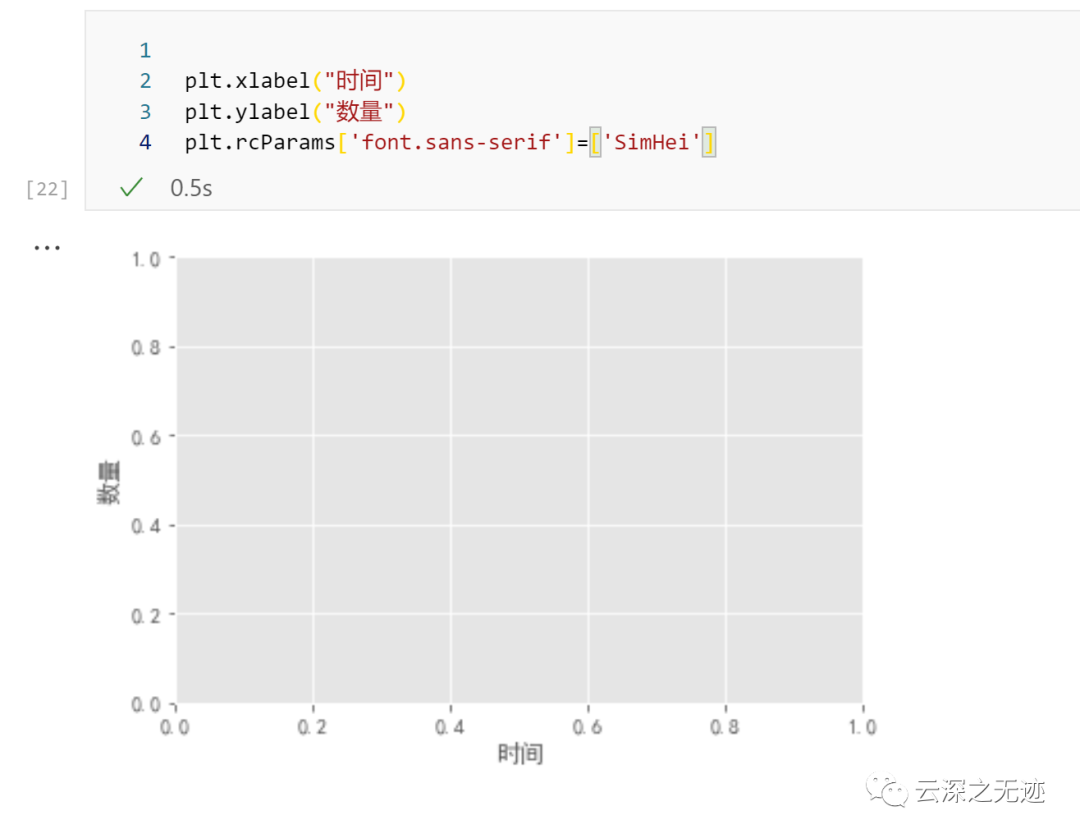
显示正常了
C:\Windows\Fonts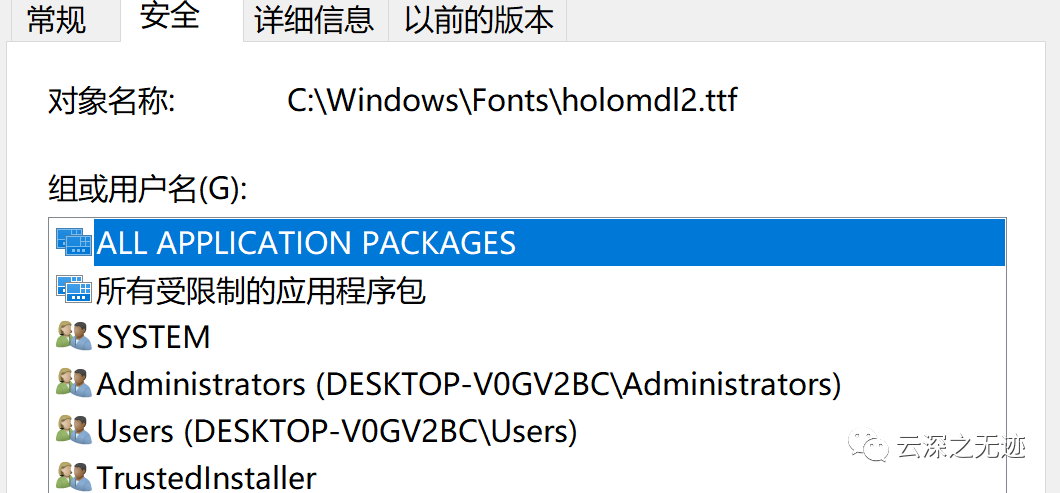
里面的字体,右键就可以看见具体的名字啥的
from matplotlib import font_managerfont = font_manager.FontProperties(fname="C:\Windows\Fonts\STXINGKA.TTF")plt.xlabel("时间", fontproperties=font)plt.ylabel("数量", fontproperties=font)
没出来结果,姿势不对?
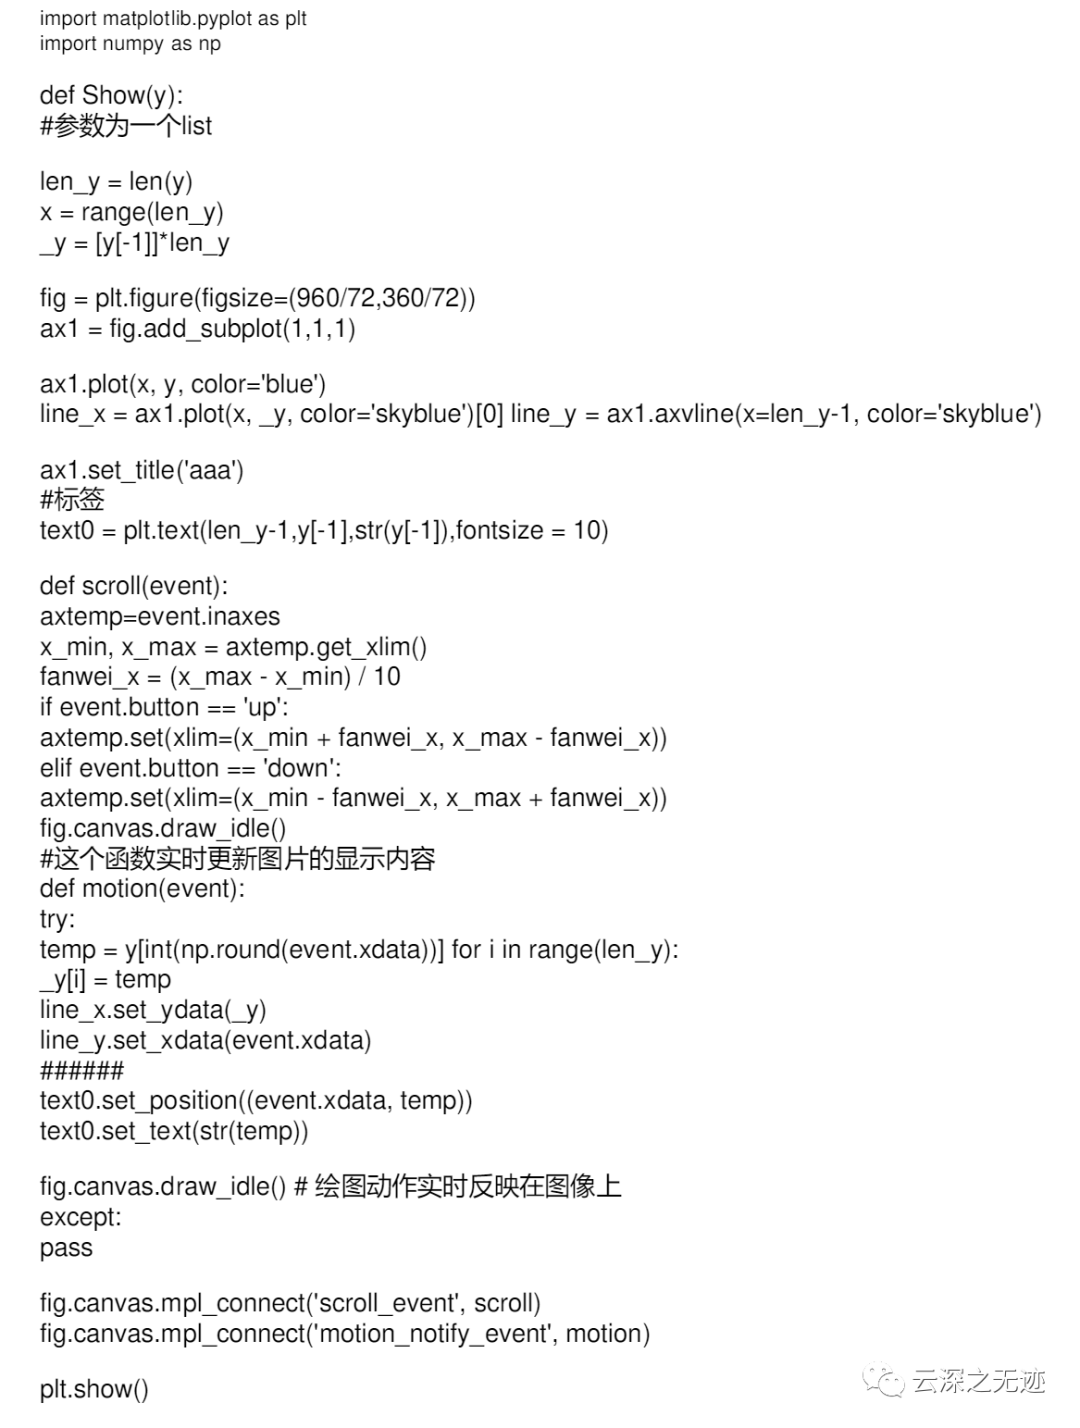
这里给一段代码,随鼠标滑动自动标注代码
xticks(ticks=None, labels=None, rotation=0, color='k', fontsize=12, alpha=None, backgroundcolor=None, fontdict=None, bbox=None)yticks(ticks=None, labels=None, rotation=0, color='k', fontsize=12, alpha=None, backgroundcolor=None, fontdict=None, bbox=None)
一般来说,如果你不指定刻度,机器自己算个出来
也可以通过这个函数来设置
ticks --- 可迭代类数组对象labels --- 更改刻度上的标签,但实际值还是ticks指定的。
剩下的参数一样
这个代码应该放在最后,作图函数的后面,不然就机器绘制了。
xlim(left, right)ylim(left, right)
轴长也是可以设置的,就是上面的是刻度
下面的是长度
其实绘图就是这样,在出结果以前,你应该在脑子里面有图的样子
left --- 左界限right --- 右界限
lim 与 ticks 这个两个都可以干预这个轴
取决于代码的前后顺序
但是lim可以小于图,就是对感兴趣的地方显著
图的表题很重要:
title(label, fontporperties=None, loc='center', pad=None, rotation, alpha, backgroundcolor, color, fontdict=None, bbox=None)函数
(1)基本参数label --- 标题fontporperties --- 同上。字体文件路径font。(注意:font设置后,fontdict部分属性失效)loc --- 标题的位置。默认"center"。其余:"left","right"pad --- 标题到图表的上下距离。浮点型数据rotation --- 旋转角度。"vertical", "horizontal"。可以为数字alpha --- 字体透明度。取值[0,1],同上。backgroundcolor --- 背景颜色。同color字体颜色使用方法。color --- 字体颜色。(2)fontdict ---字体字典参数(key加引号),包含font属性"fontsize":12 --- 字体大小,默认12。整型"fontweight":"medium" --- 字体粗细。可选:'light', 'normal', 'medium', 'semibold', 'bold', 'heavy', 'black'"fontstyle":"normal" --- 字体风格。可选:"normal", "italic"-斜体, "oblique"-倾斜"verticalalignment":"baseline" --- 设置垂直对齐方式。可选:"center", "bottom", "top", "baseline""horizontalalignment":"center" --- 设置水平对齐方式。可选:"left","right","center"注意:fontdict里的参数可不加引号,然后直接当做基本参数使用(3)bbox ---设置标题盒属性字典参数(key不加引号)boxstyle --- 设置边框风格。如:"round"facecolor --- 设置标题框背景颜色。edgecolor --- 设置边框颜色。linewidth --- 设置边框厚度。alpha --- 设置背景透明度
注释文本:
annotate(text, xy, xytext, arrowprops=dict(), fontdict=None, bbox=None)(1)基本属性text --- 注释文本内容xy --- 要注释点的坐标xytext --- 注释文本的新坐标color --- 注释的颜色(2)arrowprops ---箭头字典属性color --- 箭头的颜色width --- 箭头的箭身的宽度headwidth --- 箭头的头部的宽度headlength --- 箭头的头部的长度shrink --- 箭头的整体长度进行缩水调整。取值[0.1,0.5),表示箭头的头部和尾部同时缩小该值比例长度;取值[0.5, 0.9]表示箭头的尾部缩小该比例。其余值按原整体长度不变。arrowstyle --- 箭头的样式风格``'-'`` None``'->'`` head_length=0.4,head_width=0.2``'-['`` widthB=1.0,lengthB=0.2,angleB=None``'|-|'`` widthA=1.0,widthB=1.0``'-|>'`` head_length=0.4,head_width=0.2``'<-'`` head_length=0.4,head_width=0.2``'<->'`` head_length=0.4,head_width=0.2``'<|-'`` head_length=0.4,head_width=0.2``'<|-|>'`` head_length=0.4,head_width=0.2``'fancy'`` head_length=0.4,head_width=0.4,tail_width=0.4``'simple'`` head_length=0.5,head_width=0.5,tail_width=0.2``'wedge'`` tail_width=0.3,shrink_factor=0.5(3)fontdict 文字属性,同上(4)bbox 盒框属性,同上。
plt.plot([-1, 0, 1],[1, 0, -1])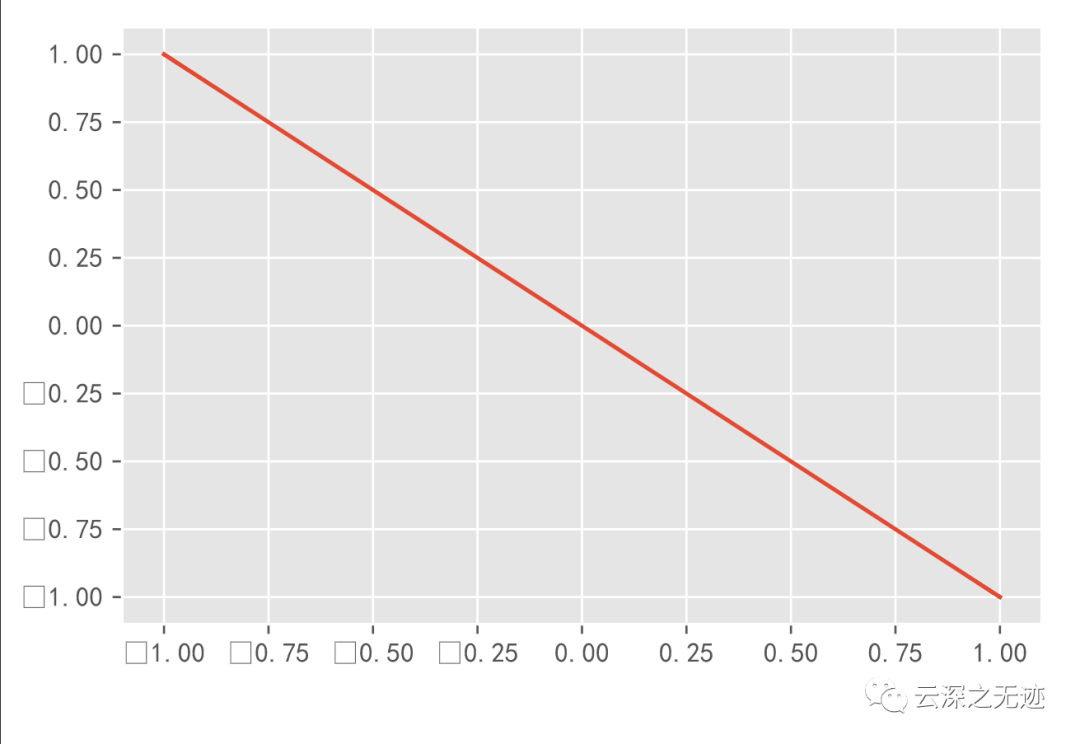
负号不显示
plt.rcParams['axes.unicode_minus'] = False# 加这代码plt.plot([-1, 0, 1], [1, 0, -1])
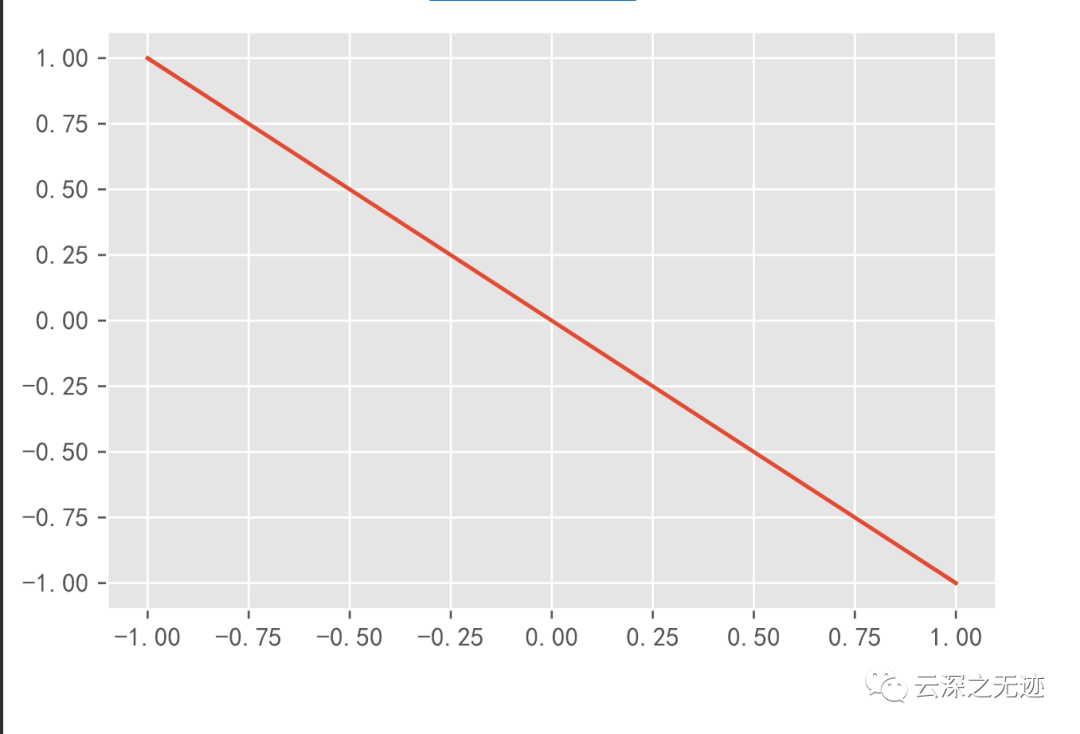
显示负号了
plt.rcParams['font.sans-serif']=['SimHei'] # 显示中文plt.rcParams['axes.unicode_minus'] = False # 显示负号
每次写程序都加这个代码行
https://blog.csdn.net/weixin_44225602/article/details/103000865文章是参考这个老哥的
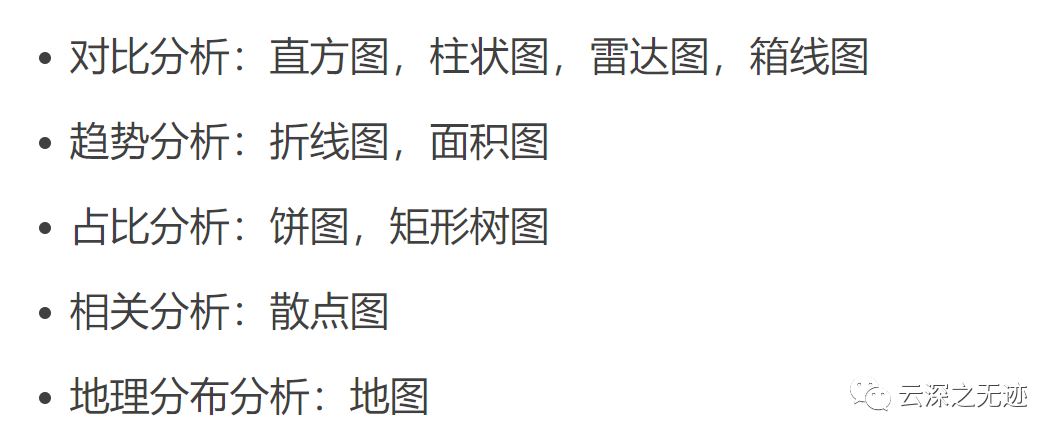
几种绘图的使用场景
bar(x, height, width=0.8, bottom=None, align='center', color='b', edgecolor='w', linewidth=None, hatch=None, joinstyle='miter', visiable=True, log=False, label=None)条形图
x --- 横坐标数据。height --- 高度,相当于y,即纵坐标数据。width --- 柱子的宽度,默认为0.8。bottom --- 柱子底部从y轴的哪一个值开始显示,即y轴底部最小值改为该值。align --- 柱子相对于刻度的位置。默认'center',刻度位于柱子中间。可选:'edge',即刻度在柱子的左边缘;将width设置为负数,可将刻度设置到柱子右边。color --- 柱子的颜色,默认蓝色-blue。edgecolor --- 柱子边缘的颜色,默认白色-white。linewidth --- 柱子边缘的宽度。hatch --- 柱子内的图案。可选:'/', '\\', '|', '-', '+', 'x', 'o', 'O', '.', '*'joinstyle --- 柱子顶部的尖角形状,默认为'miter',即直角。可选: 'round', 'bevel',即圆角和倾斜角。visiable --- 图案是否可见,默认True。False即为空图。log --- 将y轴设置为log数据,默认为False。label --- 图片自身的标签。
参数意思
movies = {"流浪地球":40.78,"飞驰人生":15.77,"疯狂的外星人":20.83,"新喜剧之王":6.10,"廉政风云":1.10,"神探蒲松龄":1.49,"小猪佩奇过大年":1.22,"熊出没·原始时代":6.71}plt.bar(x=list(movies.keys()), height=list(movies.values()),width=0.8,align='center',alpha=0.2, color='red',linewidth=9,edgecolor='b',hatch='\\',joinstyle='round')plt.xticks(list(movies.keys()), rotation=90)plt.grid()
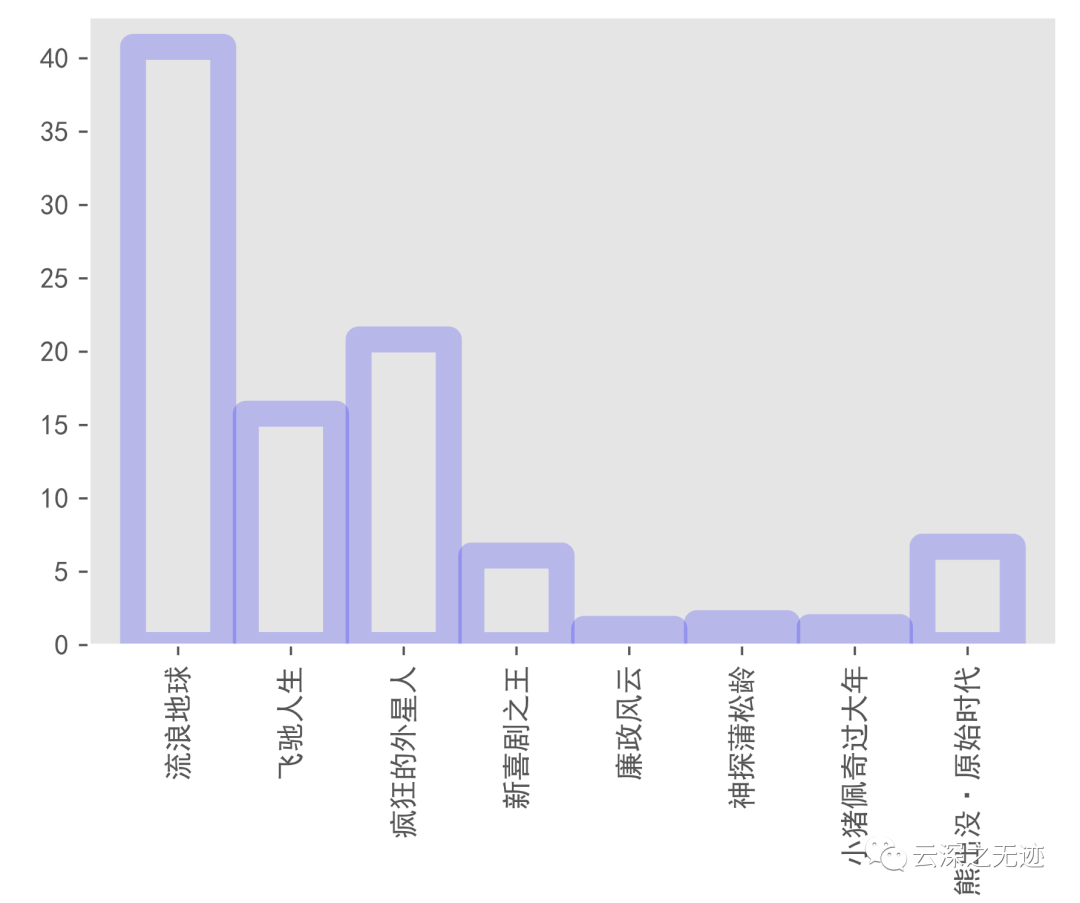
样子,上面有代码行