点击左上角“锂电联盟会长”,即可关注!


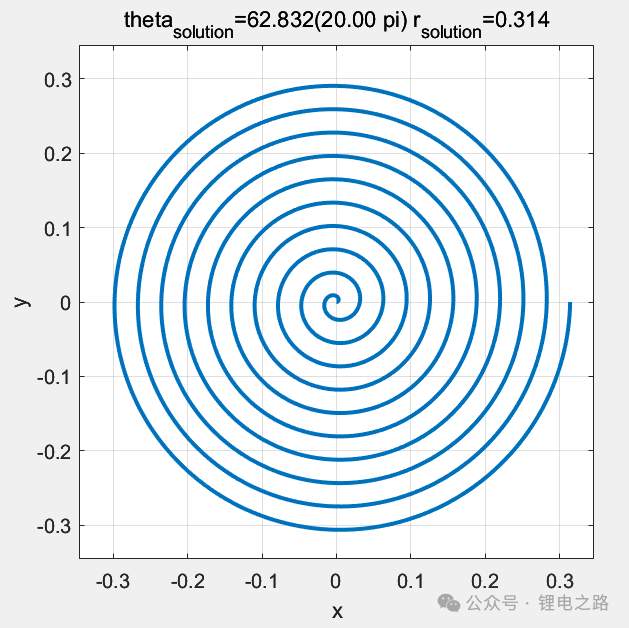
S,需要求解终点圆心角theta-solution 时,我们需要解方程 S = L(a, b, theta-solution) - L(a, b, θ_start)。由于上述弧长表达式较为复杂,直接反解 θ_solution 没有初等函数形式的解,因此通常需要采用数值法进行求解,如牛顿迭代法等。function [theta_solution,r_solution]=solve_theta(a,b,theta_start,s_know)L = @(a,b,theta) (b.^2*theta+a.*b)./(2*b.^2).*sqrt(b.^2*theta.^2+2*a.*b.*theta+a.^2+b.^2)...+b./2.*log(abs(b.*theta+a+sqrt(b.^2*theta.^2+2*a.*b.*theta+a.^2+b.^2)));arc_length =@(a,b,theta_start,theta_end) L(a,b,theta_end)-L(a,b,theta_start);theta_guess = s_know / sqrt((a + b*0)^2 + b^2);options = optimset('TolX',1e-6);theta_solution = fzero(@(theta) arc_length(a,b,theta_start,theta) - s_know, theta_guess, options);r_solution=a+b*theta_solution;%% 绘图theta_plot=linspace(theta_start,theta_solution,2000);r_plot=a+b.*theta_plot;x_plot=r_plot.*cos(theta_plot);y_plot=r_plot.*sin(theta_plot);figureplot(x_plot,y_plot,'-',LineWidth=2)xlabel('x');ylabel('y');maxR = max(r_plot);xlim([-maxR*1.1, maxR*1.1]);ylim([-maxR*1.1, maxR*1.1]);axis square;grid on;title(sprintf('theta_{solution}=%.3f(%.2f pi) r_{solution}=%.3f',theta_solution,theta_solution/pi,r_solution))end
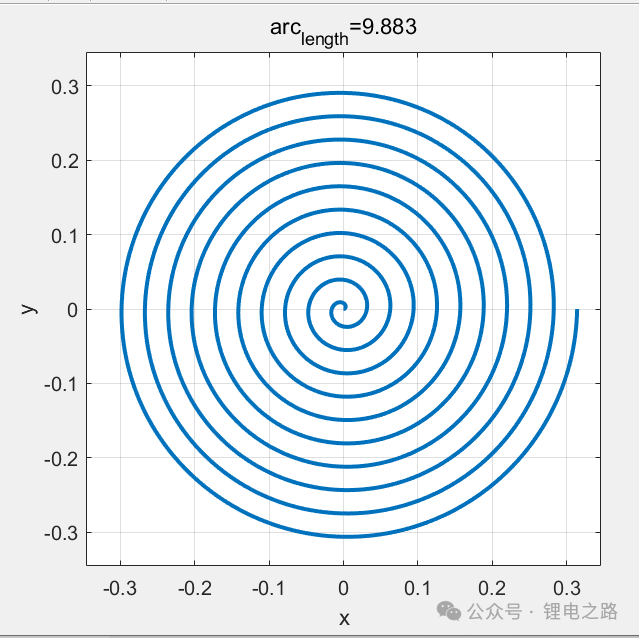
function [arc_length]=solve_arc(a,b,theta_start,theta_end)L = @(a,b,theta) (b.^2*theta+a.*b)./(2*b.^2).*sqrt(b.^2*theta.^2+2*a.*b.*theta+a.^2+b.^2)...+b./2.*log(abs(b.*theta+a+sqrt(b.^2*theta.^2+2*a.*b.*theta+a.^2+b.^2)));arc_length = L(a,b,theta_end)-L(a,b,theta_start);%% 绘图theta_plot=linspace(theta_start,theta_end,2000);r_plot=a+b.*theta_plot;x_plot=r_plot.*cos(theta_plot);y_plot=r_plot.*sin(theta_plot);figureplot(x_plot,y_plot,'-',LineWidth=2)xlabel('x');ylabel('y');maxR = max(r_plot);xlim([-maxR*1.1, maxR*1.1]);ylim([-maxR*1.1, maxR*1.1]);axis square;grid on;title(sprintf('arc_{length}=%.3f',arc_length));end
a=0;b=0.005;theta_start=0;s_know=9.883;[theta_solution,r_solution]=solve_theta(a,b,theta_start,s_know);theta_end=20*pi;[arc_length]=solve_arc(a,b,theta_start,theta_end);

function solveThetaNewton(a, b, theta_start, s_know) {// 定义 f(theta),要求解 f(theta)= 0,即满足 arc_length(a, b, theta_start, theta) - s_know = 0function f(theta) {return arc_length(a, b, theta_start, theta) - s_know;}// 定义 f(theta) 关于 theta 的导数 f'(theta)// 由于 L(a, b, theta) 的导数正好是积分所用的被积函数,所以:// f′(theta) = d/dtheta L(a, b, theta) = sqrt(b^2 * theta^2 + 2*a*b*theta + a^2 + b^2)function fp(theta) {return Math.sqrt(b * b * theta * theta + 2 * a * b * theta + a * a + b * b);}// 初始化 theta 的猜测值// 当 theta 较小时,arc_length(a,b, theta_start, theta) 近似为 fp(0)*theta,// 因此可取 theta ≈ s_know / fp(0) 作为初始值let theta = s_know / fp(0);const tolerance = 1e-6; // 收敛容限,迭代停止条件:|f(theta)| < toleranceconst maxIterations = 100; // 最大迭代次数let iteration = 0;// 牛顿迭代法:theta_new = theta_old - f(theta_old) / fp(theta_old)while (Math.abs(f(theta)) > tolerance && iteration < maxIterations) {theta = theta - f(theta) / fp(theta);iteration++;}return theta;}
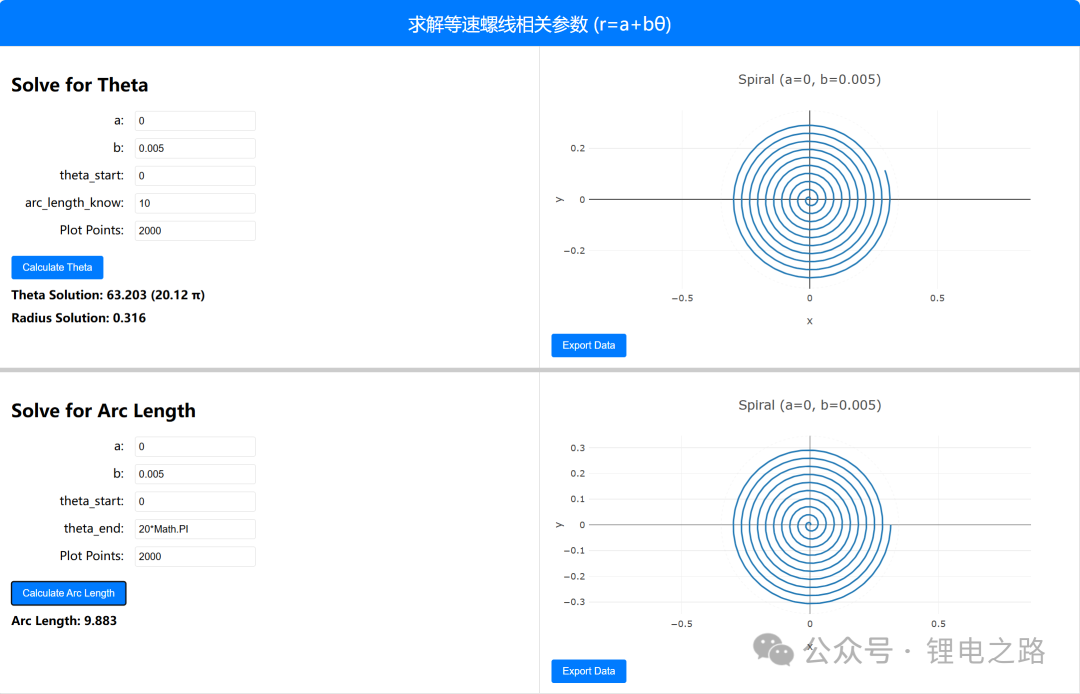
<html><head><meta charset="UTF-8"><title>Spiral Calculationstitle><meta name="viewport" content="width=device-width, initial-scale=1.0"><script src="https://cdn.plot.ly/plotly-latest.min.js">script><style>html, body {height: 100%;margin: 0;}/* 标题栏样式 */.header {background: #007bff;color: white;font-size: 24px;text-align: center;padding: 15px;box-sizing: border-box;}/* 整个容器充满视窗,并按垂直方向排列 */.container {height: calc(100vh - 65px); /* 减去标题栏高度 */width: 100%;display: flex;flex-direction: column;}/* 每个功能模块:带有左右参数与图形的水平两栏 */.section {overflow: auto;border: 1px solid #ccc;box-sizing: border-box;}/* 初始高度各占50% */#section1, #section2 {height: 50%;}/* 横向两栏布局 */.horizontal {display: flex;flex-direction: row;flex-wrap: wrap;}.param-col, .plot-col {flex: 1;padding: 15px;box-sizing: border-box;min-width: 250px;}.param-col {border-right: 1px solid #ccc;}/* 小屏幕时调整为纵向布局 */@media (max-width: 600px) {.horizontal {flex-direction: column;}.param-col, .plot-col {width: 100%;border-right: none;border-bottom: 1px solid #ccc;}}/* 分隔条样式 */.splitter {height: 5px;background: #ccc;cursor: row-resize;}.input-group {margin-bottom: 10px;}label {display: inline-block;width: 150px;text-align: right;margin-right: 10px;}input[type="text"], input[type="number"] {width: 150px;padding: 5px;border-radius: 3px;border: 1px solid #ddd;}button {padding: 8px 15px;margin-top: 10px;border: none;border-radius: 3px;background-color: #007bff;color: white;cursor: pointer;}button:hover {background-color: #0056b3;}.output {margin-top: 10px;font-weight: bold;}.plotly-graph-div {width: 100%;height: calc(100% - 40px); /* 留出部分高度给标题和按钮 */}style>head><body><div class="header">求解等速螺线相关参数 (r=a+bθ)div><div class="container"><div id="section1" class="section horizontal"><div class="param-col"><h2>Solve for Thetah2><div class="input-group"><label for="theta_a">a:label><input type="text" id="theta_a" value="0">div><div class="input-group"><label for="theta_b">b:label><input type="text" id="theta_b" value="0.005">div><div class="input-group"><label for="theta_start">theta_start:label><input type="text" id="theta_start" value="0">div><div class="input-group"><label for="s_know">arc_length_know:label><input type="text" id="s_know" value="10">div><div class="input-group"><label for="theta_numPoints">Plot Points:label><input type="text" id="theta_numPoints" value="2000">div><button onclick="calculateTheta()">Calculate Thetabutton><div class="output">Theta Solution: <span id="theta_solution_output">span>div><div class="output">Radius Solution: <span id="r_solution_output">span>div>div><div class="plot-col"><div id="theta_plot" class="plotly-graph-div">div><button onclick="exportData('theta_plot')">Export Databutton>div>div><div id="splitter" class="splitter">div><div id="section2" class="section horizontal"><div class="param-col"><h2>Solve for Arc Lengthh2><div class="input-group"><label for="arc_a">a:label><input type="text" id="arc_a" value="0">div><div class="input-group"><label for="arc_b">b:label><input type="text" id="arc_b" value="0.005">div><div class="input-group"><label for="arc_start">theta_start:label><input type="text" id="arc_start" value="0">div><div class="input-group"><label for="arc_end">theta_end:label><input type="text" id="arc_end" value="20*Math.PI">div><div class="input-group"><label for="arc_numPoints">Plot Points:label><input type="text" id="arc_numPoints" value="2000">div><button onclick="calculateArcLength()">Calculate Arc Lengthbutton><div class="output">Arc Length: <span id="arc_length_output">span>div>div><div class="plot-col"><div id="arc_plot" class="plotly-graph-div">div><button onclick="exportData('arc_plot')">Export Databutton>div>div>div><script>// 全局对象,用于存储每个绘图区域的导出数据let exportDataMap = {};// --- 数值求解与绘图相关函数 ---// 对用户输入表达式求值(支持比如 "2*Math.PI")function evaluateInput(expression) {try {return eval(expression);} catch (error) {console.error("Invalid input:", error);alert("Invalid input: Please enter valid numbers or mathematical expressions.");return NaN;}}// 定义 L(a, b, theta) 为积分原函数function L(a, b, theta) {const sqrtPart = Math.sqrt(b * b * theta * theta + 2 * a * b * theta + a * a + b * b);const logPart = Math.log(Math.abs(b * theta + a + sqrtPart));return ((b * b * theta + a * b) / (2 * b * b)) * sqrtPart + (b / 2) * logPart;}// 弧长计算: arc_length = L(a, b, theta_end) - L(a, b, theta_start)function arc_length(a, b, theta_start, theta_end) {return L(a, b, theta_end) - L(a, b, theta_start);}// 使用 Newton 法求解 f(theta)=arc_length(a,b,theta_start,theta)-s_know = 0function solveThetaNewton(a, b, theta_start, s_know) {function f(theta) {return arc_length(a, b, theta_start, theta) - s_know;}// f'(theta) = d/dtheta L(a, b, theta) = sqrt(b^2*theta^2 + 2*a*b*theta + a^2 + b^2)function fp(theta) {return Math.sqrt(b * b * theta * theta + 2 * a * b * theta + a * a + b * b);}// 初始猜测:使用 s_know 除以 fp(0)let theta = s_know / fp(0);const tolerance = 1e-6;const maxIterations = 500;let iteration = 0;while (Math.abs(f(theta)) > tolerance && iteration < maxIterations) {theta = theta - f(theta) / fp(theta);iteration++;}return theta;}function calculateTheta() {const a = evaluateInput(document.getElementById('theta_a').value);const b = evaluateInput(document.getElementById('theta_b').value);const theta_start = evaluateInput(document.getElementById('theta_start').value);const s_know = evaluateInput(document.getElementById('s_know').value);const numPoints = evaluateInput(document.getElementById('theta_numPoints').value);if (isNaN(a) || isNaN(b) || isNaN(theta_start) || isNaN(s_know) || isNaN(numPoints)) return;const theta_solution = solveThetaNewton(a, b, theta_start, s_know);const r_solution = a + b * theta_solution;document.getElementById('theta_solution_output').textContent =theta_solution.toFixed(3) + ' (' + (theta_solution / Math.PI).toFixed(2) + ' π)';document.getElementById('r_solution_output').textContent = r_solution.toFixed(3);drawSpiral('theta_plot', a, b, theta_start, theta_solution, numPoints);}function calculateArcLength() {const a = evaluateInput(document.getElementById('arc_a').value);const b = evaluateInput(document.getElementById('arc_b').value);const theta_start = evaluateInput(document.getElementById('arc_start').value);const theta_end = evaluateInput(document.getElementById('arc_end').value);const numPoints = evaluateInput(document.getElementById('arc_numPoints').value);if (isNaN(a) || isNaN(b) || isNaN(theta_start) || isNaN(theta_end) || isNaN(numPoints)) return;const length = arc_length(a, b, theta_start, theta_end);document.getElementById('arc_length_output').textContent = length.toFixed(3);drawSpiral('arc_plot', a, b, theta_start, theta_end, numPoints);}// 绘制螺旋曲线:将极坐标转换为直角坐标,并调用 Plotly 绘图// 同时将绘图数据保存到 exportDataMap 中function drawSpiral(plotDivId, a, b, thetaStart, thetaEnd, numPoints) {const theta_values = [];const r_values = [];const x_values = [];const y_values = [];for (let i = 0; i < numPoints; i++) {const theta = thetaStart + (thetaEnd - thetaStart) * i / (numPoints - 1);const r = a + b * theta;theta_values.push(theta);r_values.push(r);x_values.push(r * Math.cos(theta));y_values.push(r * Math.sin(theta));}// 保存数据用于导出exportDataMap[plotDivId] = {theta: theta_values,r: r_values,x: x_values,y: y_values};const data = [{x: x_values,y: y_values,mode: 'lines',type: 'scatter',line: { width: 2 }}];const layout = {xaxis: {title: 'x',scaleanchor: 'y',scaleratio: 1},yaxis: { title: 'y' },title: `Spiral (a=${a}, b=${b})`,autosize: true,margin: { l: 50, r: 50, b: 50, t: 70, pad: 4 },shapes: [{type: 'circle',xref: 'x',yref: 'y',x0: -Math.max(...r_values) * 1.1,y0: -Math.max(...r_values) * 1.1,x1: Math.max(...r_values) * 1.1,y1: Math.max(...r_values) * 1.1,opacity: 0.2,line: { color: 'lightgray', width: 1, dash: 'dot' }}]};Plotly.newPlot(plotDivId, data, layout, { responsive: true });}// 导出数据函数,生成 CSV 文件格式:4 列(theta, r, x, y)function exportData(plotDivId) {const dataObj = exportDataMap[plotDivId];if (!dataObj) {alert("当前没有可导出的数据!");return;}const { theta, r, x, y } = dataObj;let csvContent = "data:text/csv;charset=utf-8,";csvContent += "theta,r,x,y\n"; // CSV 表头const numRows = theta.length;for (let i = 0; i < numRows; i++) {csvContent += `${theta[i]},${r[i]},${x[i]},${y[i]}\n`;}// 创建下载链接并自动触发下载动作const encodedUri = encodeURI(csvContent);const link = document.createElement("a");link.setAttribute("href", encodedUri);link.setAttribute("download", `${plotDivId}_data.csv`);document.body.appendChild(link); // 需要将链接添加到DOM中才能触发点击link.click();document.body.removeChild(link);}// --- 分隔条(上下模块高度调节)实现 ---document.addEventListener("DOMContentLoaded", function() {const splitter = document.getElementById("splitter");const section1 = document.getElementById("section1");const section2 = document.getElementById("section2");const container = document.querySelector(".container");let isDragging = false;splitter.addEventListener("mousedown", function(e) {isDragging = true;e.preventDefault();});document.addEventListener("mousemove", function(e) {if (!isDragging) return;const containerRect = container.getBoundingClientRect();const offsetY = e.clientY - containerRect.top;const minHeight = 100; // 最小高度限制if (offsetY < minHeight || offsetY > containerRect.height - minHeight - splitter.offsetHeight) {return;}section1.style.height = offsetY + "px";section2.style.height = (containerRect.height - offsetY - splitter.offsetHeight) + "px";});document.addEventListener("mouseup", function(e) {if (isDragging) {isDragging = false;}});});script>body>html>