
(1)全波整流信号

◎ 解答:
下面是该信号的波形,信号是周期信号。

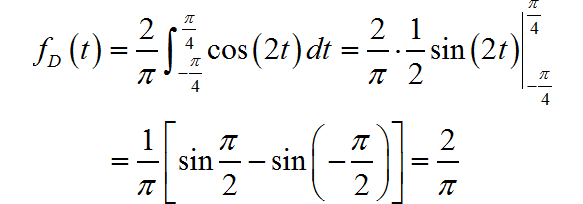
▲ 图1.1.1 信号波形信号的直流分量为:

(2) 周期矩形信号
◎ 解答:
下面是该信号的波形:
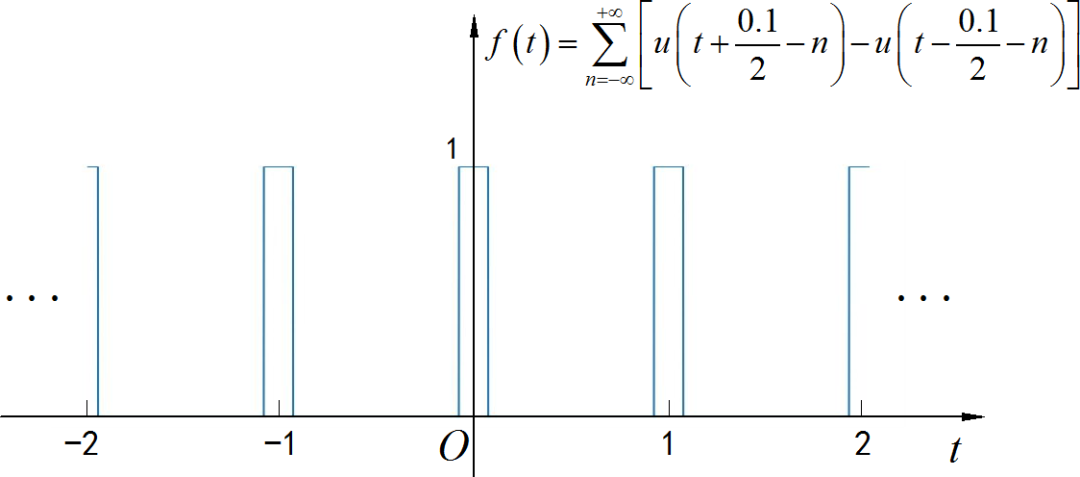
▲ 图1.1.2 信号波形信号的直流分量:

信号的交流分量:

(3) 周期冲激信号

◎ 解答:
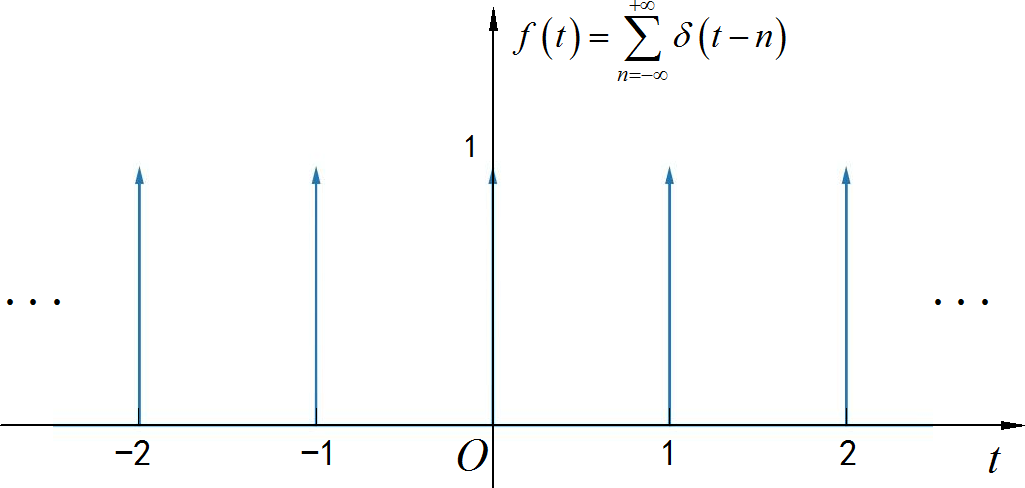
▲ 图1.1.3 信号波形信号的直流分量:

信号的交流分量:

from headm import *

def fun(t):
    f = t*0
    for id,tt in enumerate(t):
        if abs(tt-int(tt)) < 0.001: f[id] = 1

    return f

t = linspace(-2.5, 2.5, 10000)
ft = fun(t)

plt.axis([min(t),max(t), -0.2, 2])
plt.plot(t, ft)

for n in range(-2, 3):
    plt.arrow(n, 1, 0.0, 0.0, shape='full', lw=0, head_width=0.05)

plt.xlabel("t")
plt.ylabel("f(t)")
plt.tight_layout()
plt.show()
(4)非周期信号

◎ 解答:
信号的波形如下图所示:
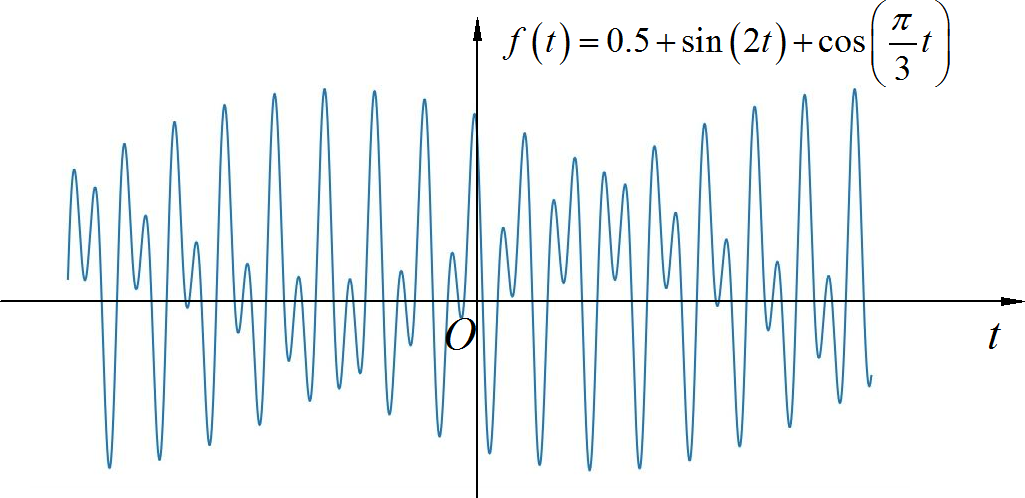
▲ 图1.1.4 信号波形信号的直流分量为:0.5;

(1) 奇偶分解
分别绘制出下面有限长信号与序列的奇分量与偶分量。
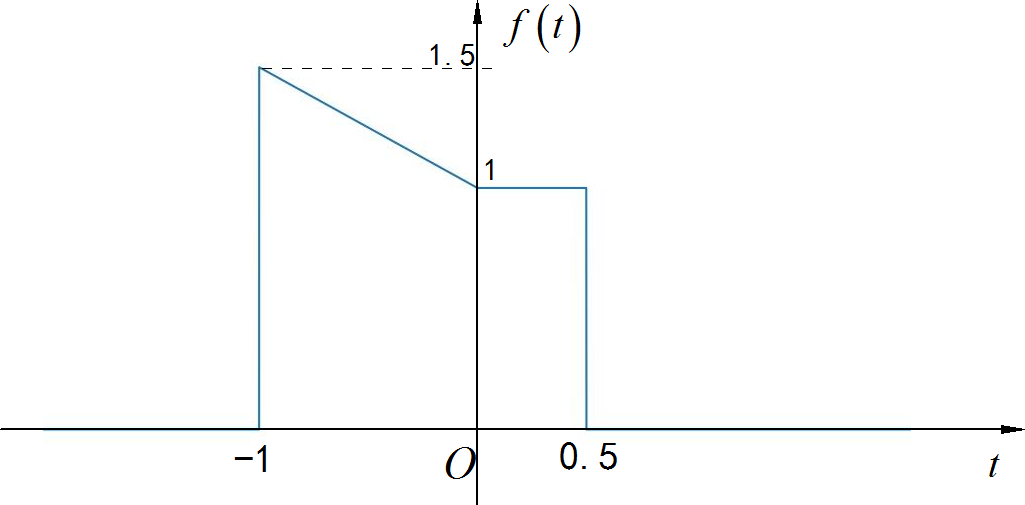
▲ 图1.2.1 连续时间信号◎ 解答:
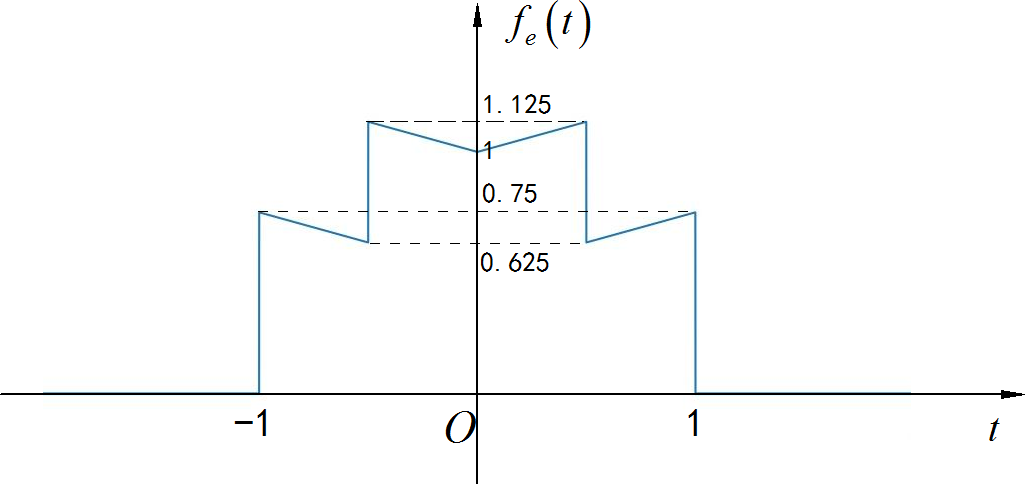
▲ 图1.2.2 信号的偶分量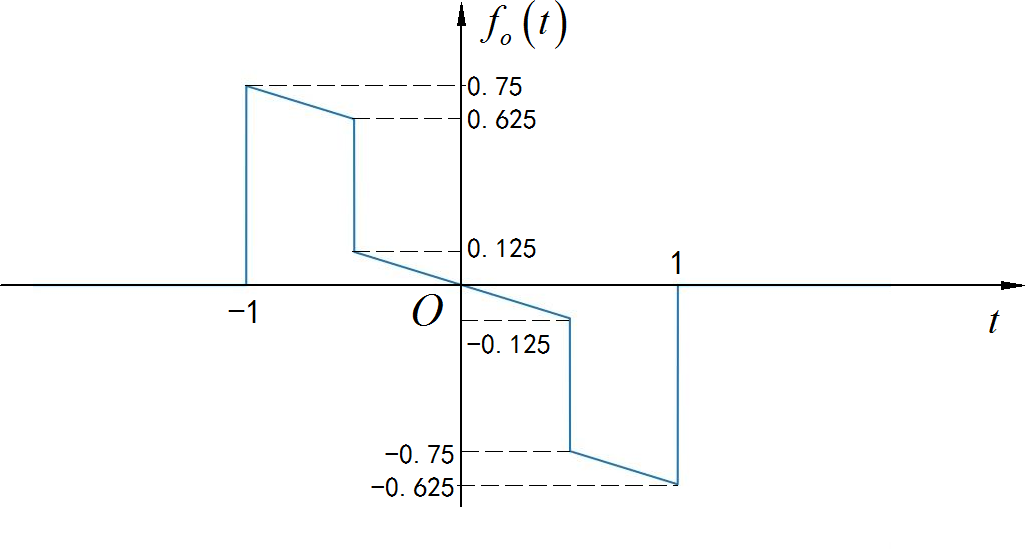
▲ 图1.2.3 信号的奇分量from headm import *
def G(t0, t1):
return heaviside(t-t0,0.5)-heaviside(t-t1,0.5)
def fun(t):
f = (-0.5*t+1)*G(-1,0) + G(0,0.5)
return f
t = linspace(-2, 2, 10000)
ft = fun(t)
ft1 = ft[::-1]
fte = (ft+ft1)/2
fto = (ft-ft1)/2
plt.axis([min(t),max(t), -0.2, 2])
plt.plot(t, ft)
plt.xlabel("t")
plt.ylabel("f(t)")
plt.tight_layout()
plt.show()
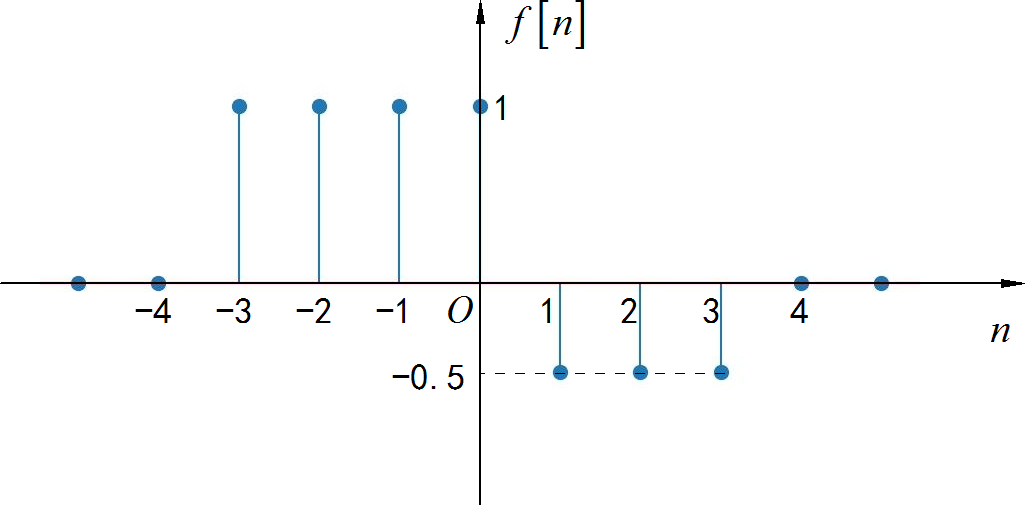
▲ 图1.2.4 离散时间序列信号from headm import *
startn = -6
endn = 6
t = linspace(startn, endn, endn-startn+1, endpoint=True)
ft = array([0,0,0,1,1,1,1,-0.5,-0.5,-0.5,0,0,0])
markerline, stemline, baseline = plt.stem(t, ft)
plt.setp(markerline, markersize=10)
plt.xlabel("t")
plt.ylabel("f(t)")
plt.axis([min(t)+0.5, max(t)-0.5, -1.5, 1.5])
plt.tight_layout()
plt.show()
◎ 解答:

▲ 图1.2.5 离散时间序列信号的偶分量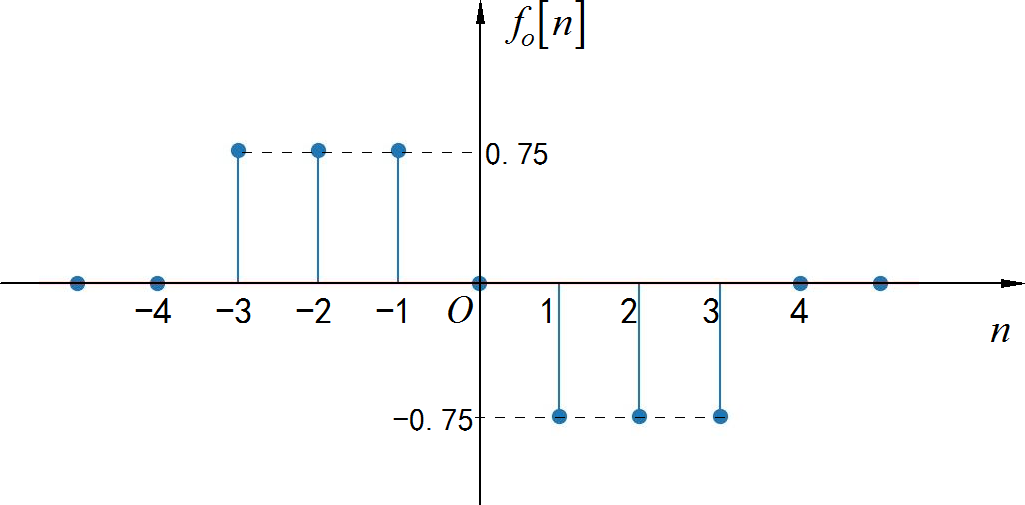
▲ 图1.2.6 离散时间序列信号的奇分量from headm import *
startn = -6
endn = 6
t = linspace(startn, endn, endn-startn+1, endpoint=True)
ft = array([0,0,0,1,1,1,1,-0.5,-0.5,-0.5,0,0,0])
ft1 = ft[::-1]
fte = (ft+ft1)/2
fto = (ft-ft1)/2
markerline, stemline, baseline = plt.stem(t, fto)
plt.setp(markerline, markersize=10)
plt.xlabel("t")
plt.ylabel("f(t)")
plt.axis([min(t)+0.5, max(t)-0.5, -1.5, 1.5])
plt.tight_layout()
plt.show()
(2) 求解原信号波形
根据已知的信号 偶分量与右半边波形, 绘制出原始信号 的波形。

▲ 图1.2.7 信号的偶分量
▲ 图1.2.8 信号的因果部分◎ 求解:
根据
可以获得信号奇分量的因果部分。
▲ 图1.2.9 奇分量的因果部分根据奇分量的对称性, 可以绘制出信号完整的奇分量。
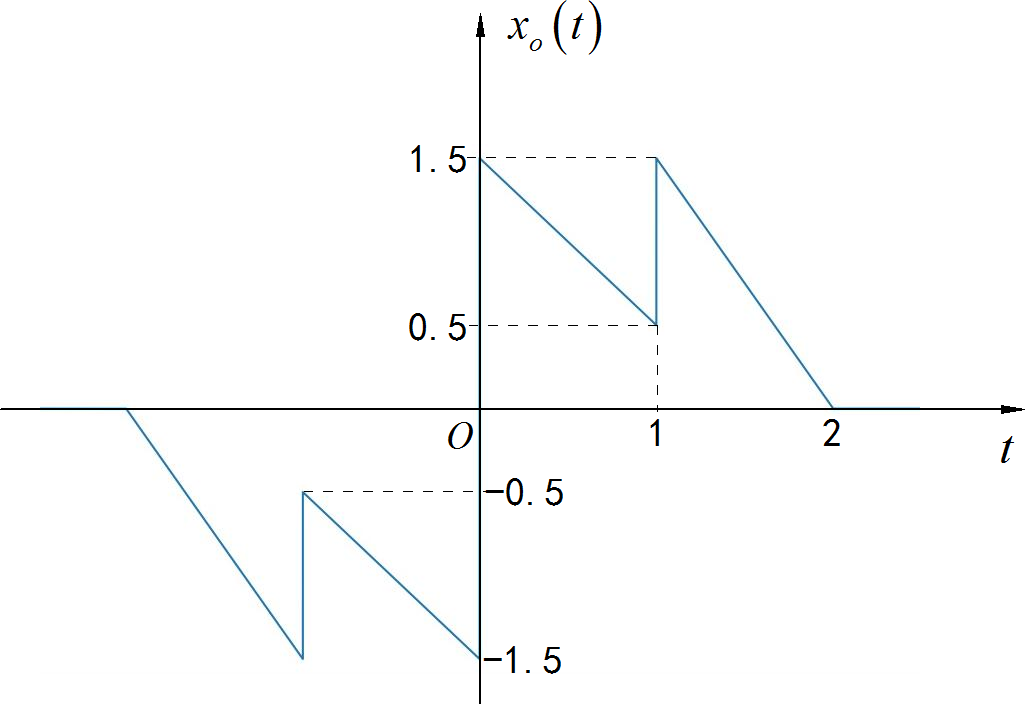
▲ 图1.2.10 信号的奇分量将信号的奇分量于偶分量叠加,可以得到信号的完整的波形。
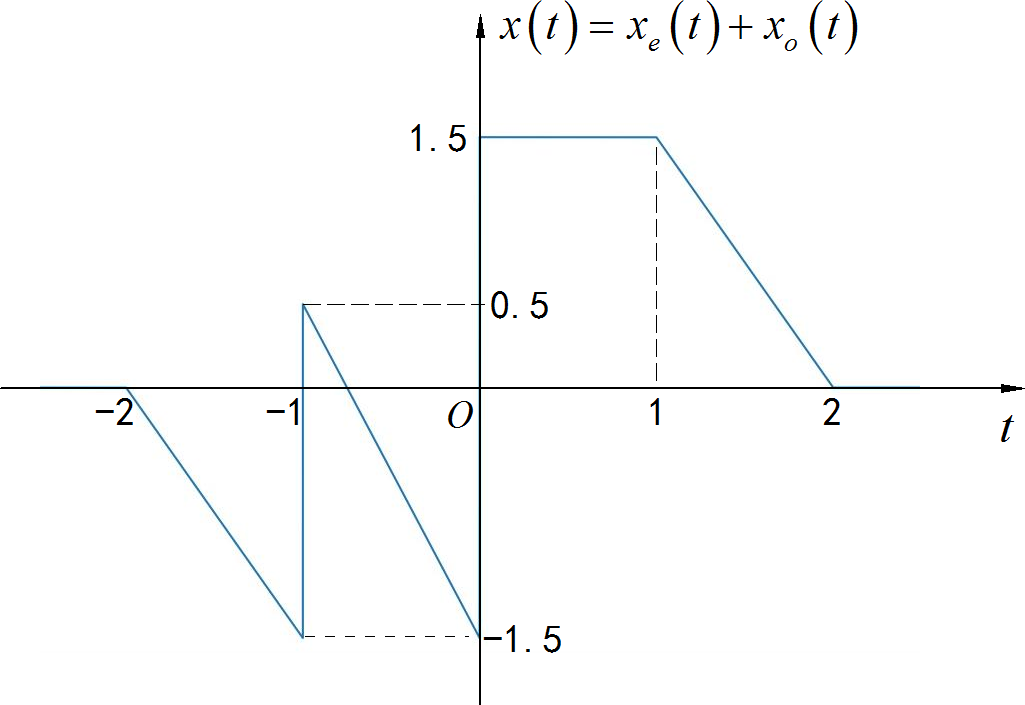
▲ 图1.2.11 信号的完整波形from headm import *
def G(t, startn, endn):
return heaviside(t-startn,0.5) - heaviside(t-endn,0.5)
def fune(t):
return t * G(t, 0, 1) - t * G(t, -1, 0)
def fune1(t):
return t * G(t, 0, 1)
def fun1(t):
return 1.5*G(t, 0, 1) - 1.5*(t-2)*G(t, 1, 2)
t = linspace(-2.5, 2.5, 100000)
ft = fune1(t)
ft1 = fun1(t)
fto1 = ft1-ft
fto2 = -fto1[::-1]
fto = fto1+fto2
fte = fune(t)
plt.plot(t, fte+fto)
plt.xlabel("t")
plt.ylabel("f(t)")
plt.axis([min(t), max(t), -1.6, 1.6])
plt.tight_layout()
plt.show()
(1) 信号进行奇偶分解
绘制出下面连续时间信号与离散时间序列的奇分量与偶分量。
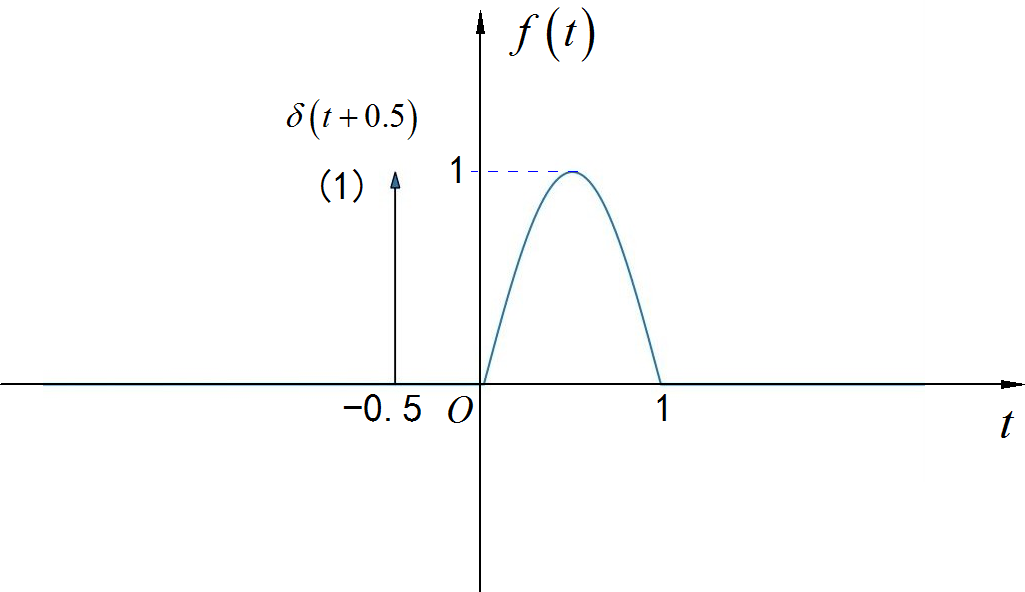
▲ 图1.2.13 连续时间信号◎ 求解:
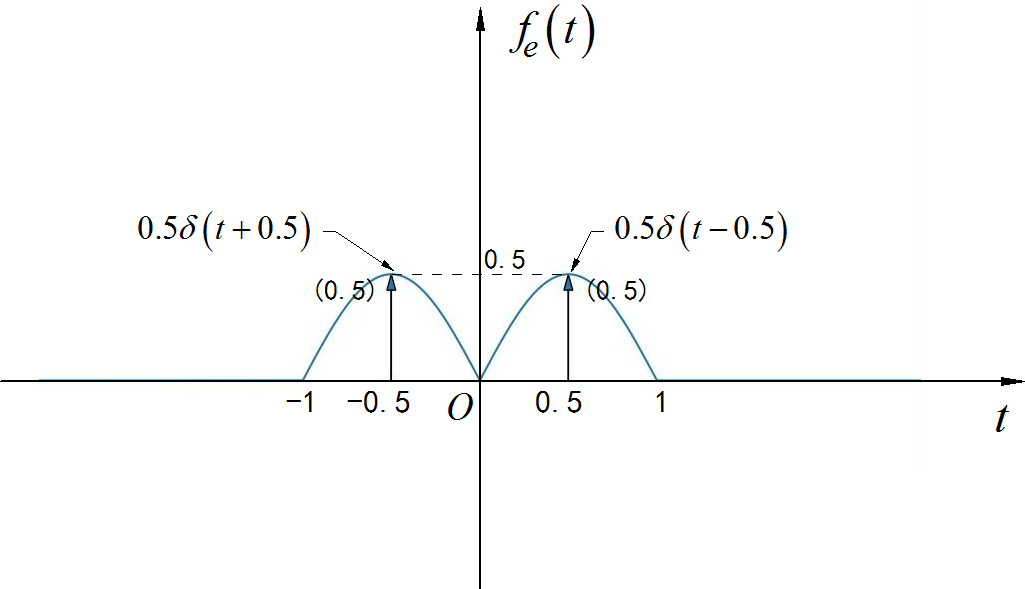
▲ 图1.2.13 信号的偶分量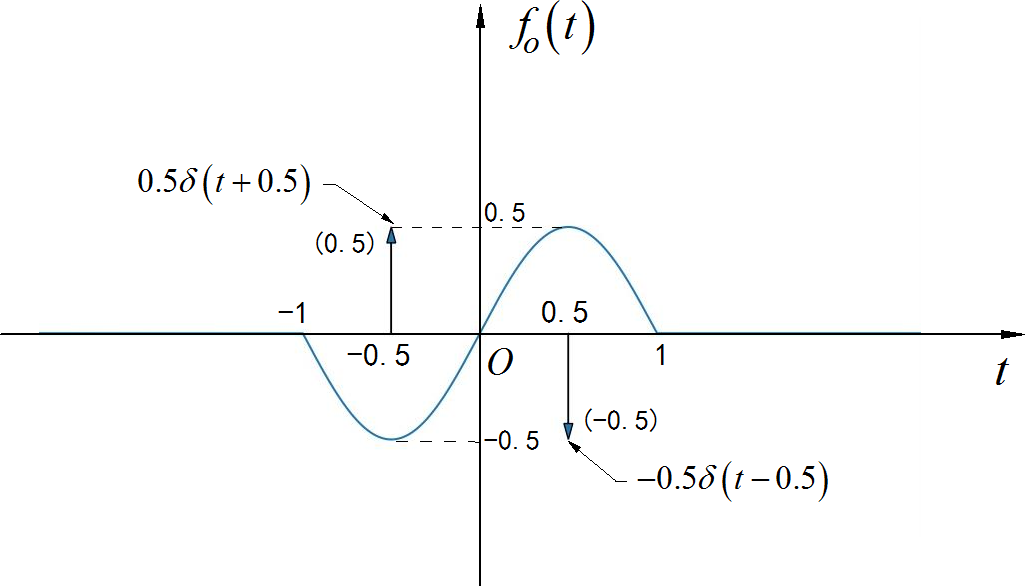
▲ 图1.2.14 信号的奇分量from headm import *
def G(t, startn, endn):
return heaviside(t-startn,0.5)-heaviside(t-endn,0.5)
def Gt(t, center, width):
startn = center-width/2
endn = startn + width
return heaviside(t-startn,0.5)-heaviside(t-endn,0.5)
def fun(t):
return sin(t*pi)*G(t,0,1) #+ Gt(t, -0.5, 0.001)
t = linspace(-2.5, 2.5, 100000)
ft = fun(t)
ft1 = ft[::-1]
fte = (ft+ft1)/2
fto = (ft-ft1)/2
plt.plot(t, fto)
plt.arrow(-0.5, 0, 0.0, 0.5, shape="full", lw=1, length_includes_head=True, head_width=0.05)
plt.arrow(0.5, 0, 0.0, -0.5, shape="full", lw=1, length_includes_head=True, head_width=0.05)
plt.xlabel("t")
plt.ylabel("ft")
plt.axis([min(t), max(t), -1.0, 1.5])
plt.tight_layout()
plt.show()
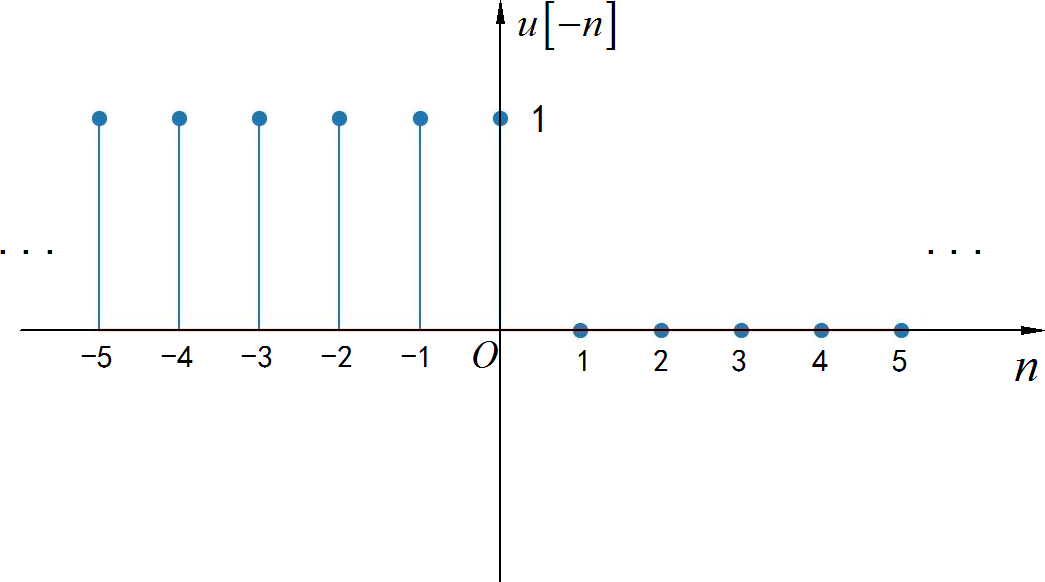
▲ 图1.2.15 反因果单位阶跃序列◎ 求解:
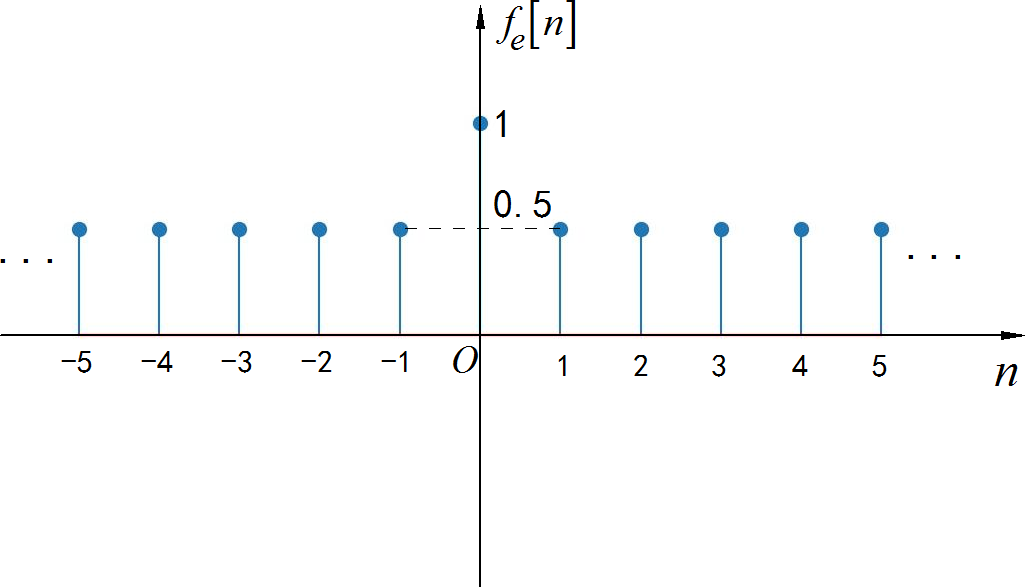
▲ 图1.2.16 信号的偶分量序列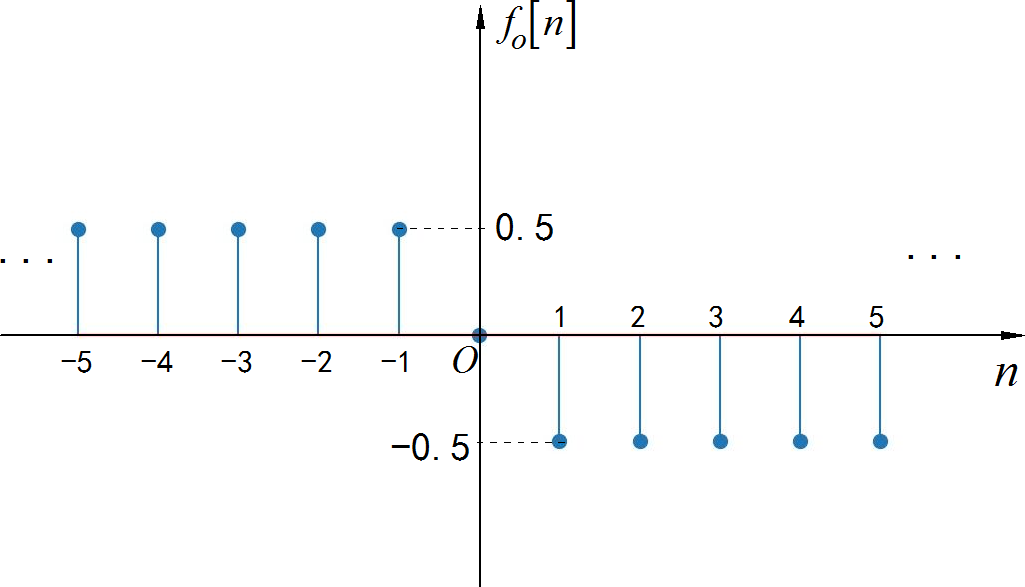
▲ 图1.2.17 信号的奇分量序列from headm import *
startn = -5
endn = 5
n = linspace(startn, endn, endn-startn+1, endpoint=True)
fn = array([0]*len(n))
fn[where(n<=0)]=1
fn1 = fn[::-1]
fne = (fn+fn1)/2
fno = (fn-fn1)/2
markerline,_,_ = plt.stem(n, fno)
plt.setp(markerline, markersize=10)
plt.xlabel("n")
plt.ylabel("f[n]")
plt.axis([min(n)-0.5, max(n)+0.5, -1, 1.5])
plt.tight_layout()
plt.show()
已知离散时间序列信号 与连续时间信号 的波形如下图所示, 请根据后面给出的表达式绘制出对应自变量变化后的信号波形。
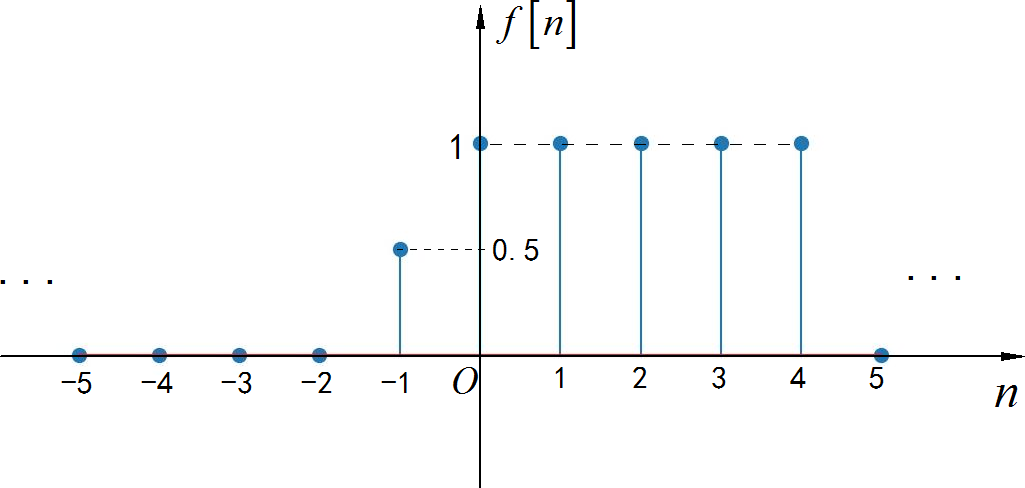
▲ 图1.3.1 离散时间序列from headm import *
startn = -5
endn = 5
n = linspace(startn, endn, endn-startn+1, endpoint=True)
fn = array([0.0]*len(n))
fn[where(n==-1)]=0.5
fn[where(n>=0)] = 1
fn[where(n==5)] = 0
fn1 = fn[::-1]
fne = (fn+fn1)/2
fno = (fn-fn1)/2
markerline,_,_ = plt.stem(n, fn)
plt.setp(markerline, markersize=10)
plt.xlabel("n")
plt.ylabel("f[n]")
plt.axis([min(n)-0.5, max(n)+0.5, -1, 1.5])
plt.tight_layout()
plt.show()
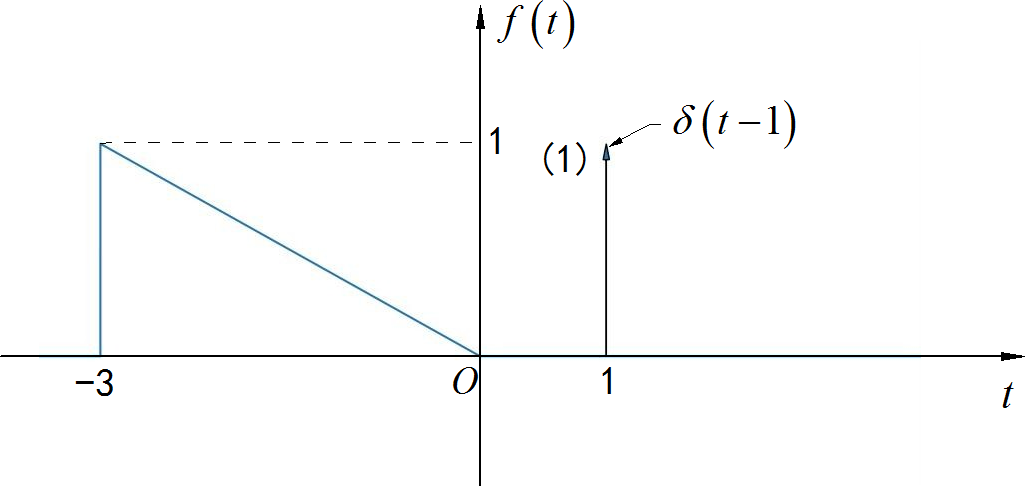
▲ 图1.3.2 连续时间信号from headm import *
def G(t, startn, endn):
return heaviside(t-startn,0.5)-heaviside(t-endn,0.5)
def Gt(t, center, width):
startn = center-width/2
endn = startn + width
return heaviside(t-startn,0.5)-heaviside(t-endn,0.5)
def fun(t):
return -1/3*t*G(t, -3, 0)
t = linspace(-3.5, 3.5, 100000)
ft = fun(t)
ft1 = ft[::-1]
fte = (ft+ft1)/2
fto = (ft-ft1)/2
plt.plot(t, ft)
plt.arrow(1, 0, 0.0, 1, shape="full", lw=1, length_includes_head=True, head_width=0.05)
plt.xlabel("t")
plt.ylabel("ft")
plt.axis([min(t), max(t), -1.0, 1.5])
plt.tight_layout()
plt.show()
(1)
 ◎ 求解:
◎ 求解:
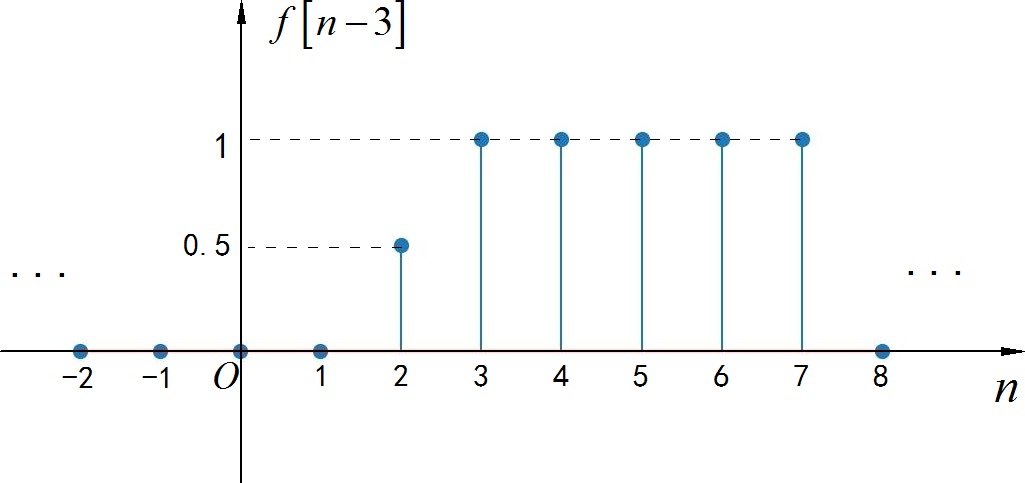
▲ 图1.3.3 序列波形(2)

◎ 求解: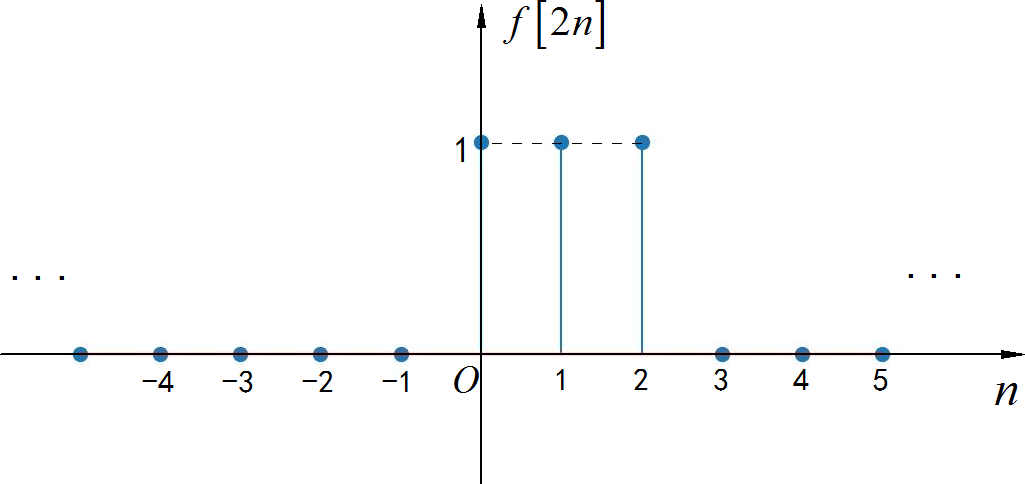
▲ 图1.3.4 序列波形(3)
 ◎ 求解:
◎ 求解:
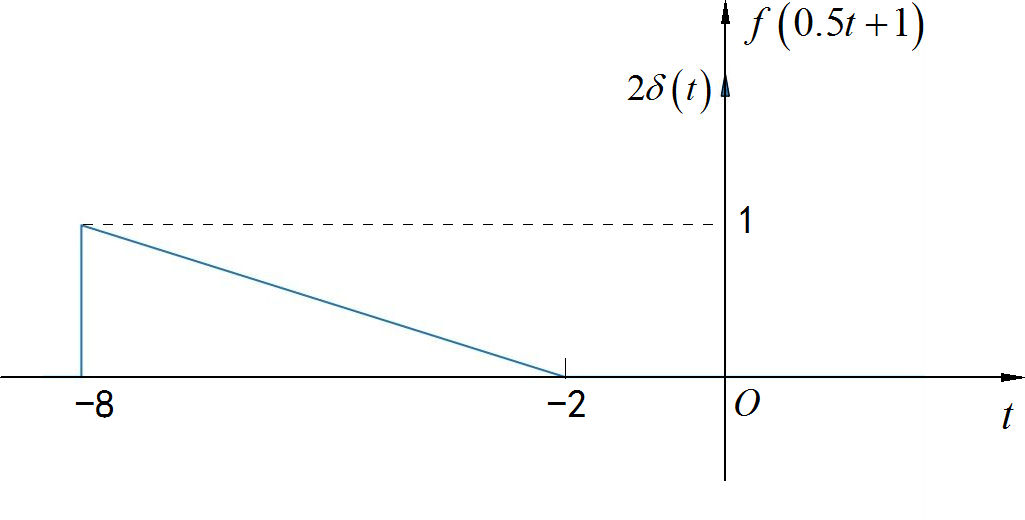
▲ 图1.3.5 信号波形(4)
 ◎ 求解:
◎ 求解:
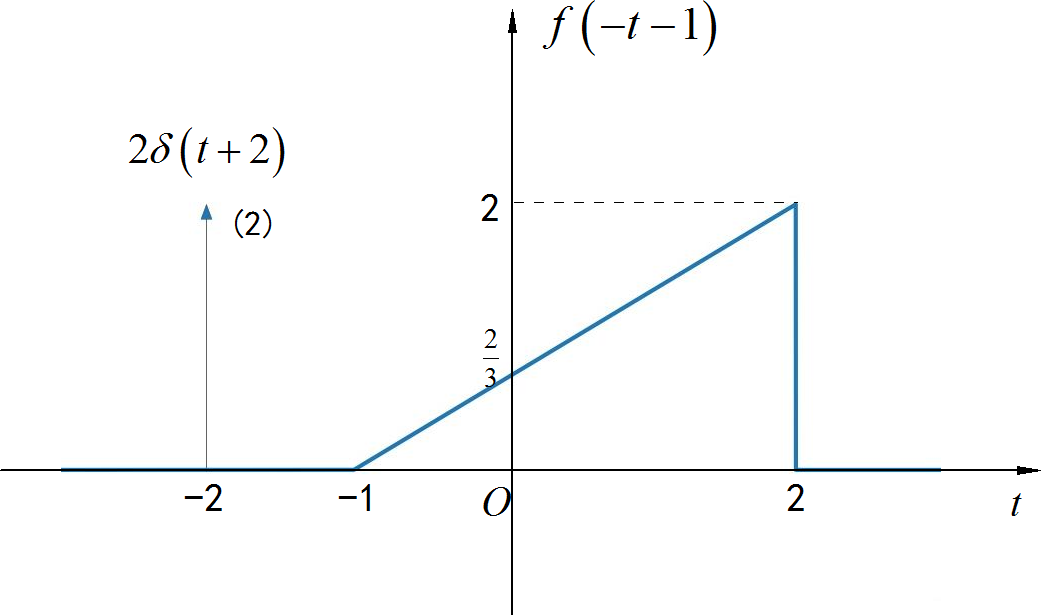
▲ 图A1.3.6 信号波形from headm import *
def G(t, startn, endn):
return heaviside(t-startn,0.5)-heaviside(t-endn,0.5)
def Gt(t, center, width):
startn = center-width/2
endn = startn + width
return heaviside(t-startn,0.5)-heaviside(t-endn,0.5)
def fun(t):
return 2/3*(t+1)*G(t, -1, 2)
t = linspace(-3, 3., 10000)
ft = fun(t)
plt.plot(t, ft, lw=3)
plt.arrow(-2, 0.0, 0.0, 2, shape="full", lw=0.2, length_includes_head=True, head_width=0.075)
plt.axis([min(t),max(t), -1, 3])
plt.xlabel("t")
plt.ylabel("ft")
plt.tight_layout()
plt.show()
(1)
◎ 求解: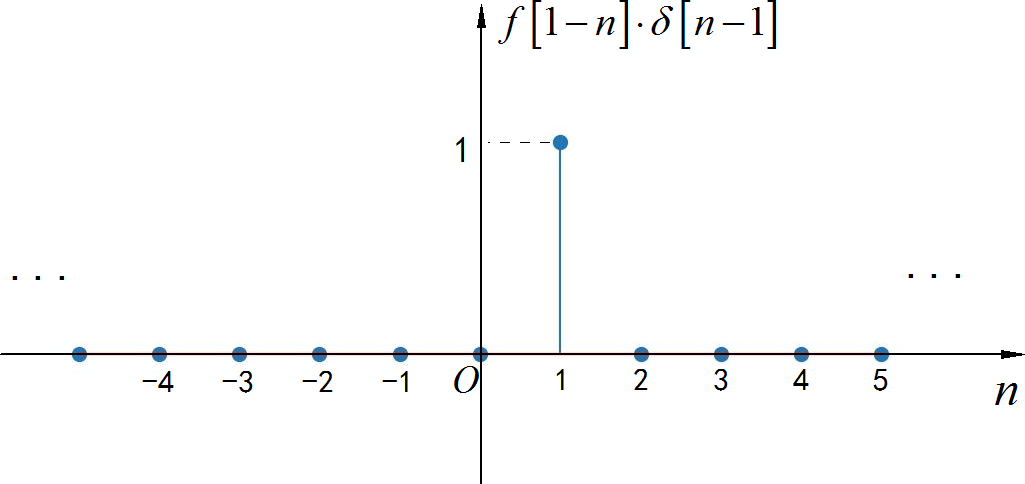
▲ 图1.3.7 序列波形(2)
 ◎ 求解:
◎ 求解:

▲ 图1.3.8 序列波形(3)
 ◎ 求解:
◎ 求解:
由于自变量需要开方,所以 。
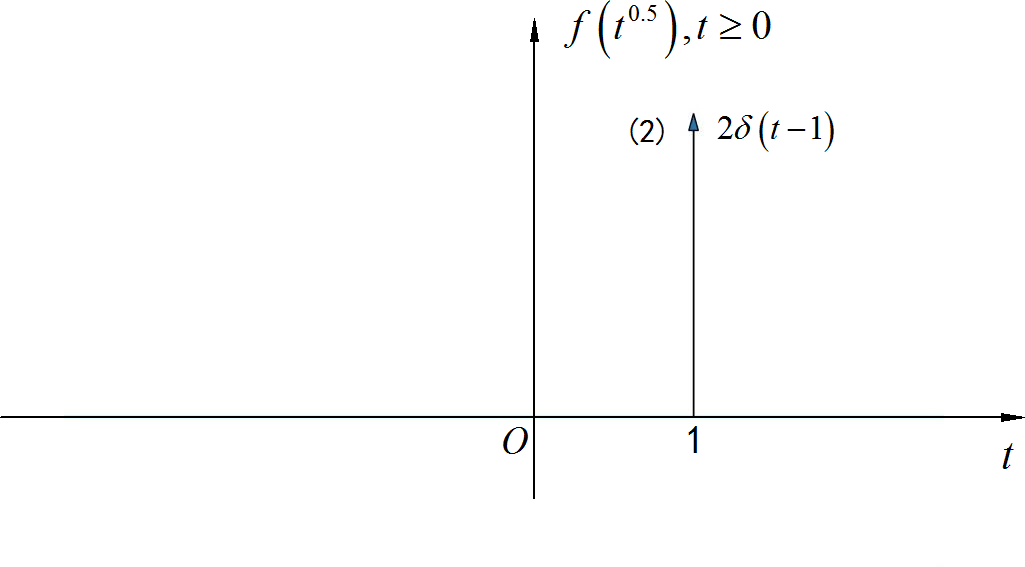
▲ 图1.3.9 信号波形(4)

◎ 求解:

▲ 图1.3.10 信号波形已知一个线性时不变(LTI)系统, 当激励为 时, 对应的系统响应为

试求当激励为 时, 对应的系统相应 的表达式。
◎ 求解:
根据 LTI 的线性于时不变特性,可知在 作用下,对应的输出

进行化简后可知: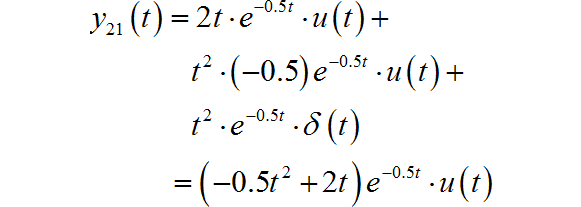
那么
Conside a LTI system whose response to the signal in Figure (A) is the signal illustrated in Figure (B). Determine and sketch carefully the response of the system to the input and illustrated in Figure (C ) and (D) respectively.
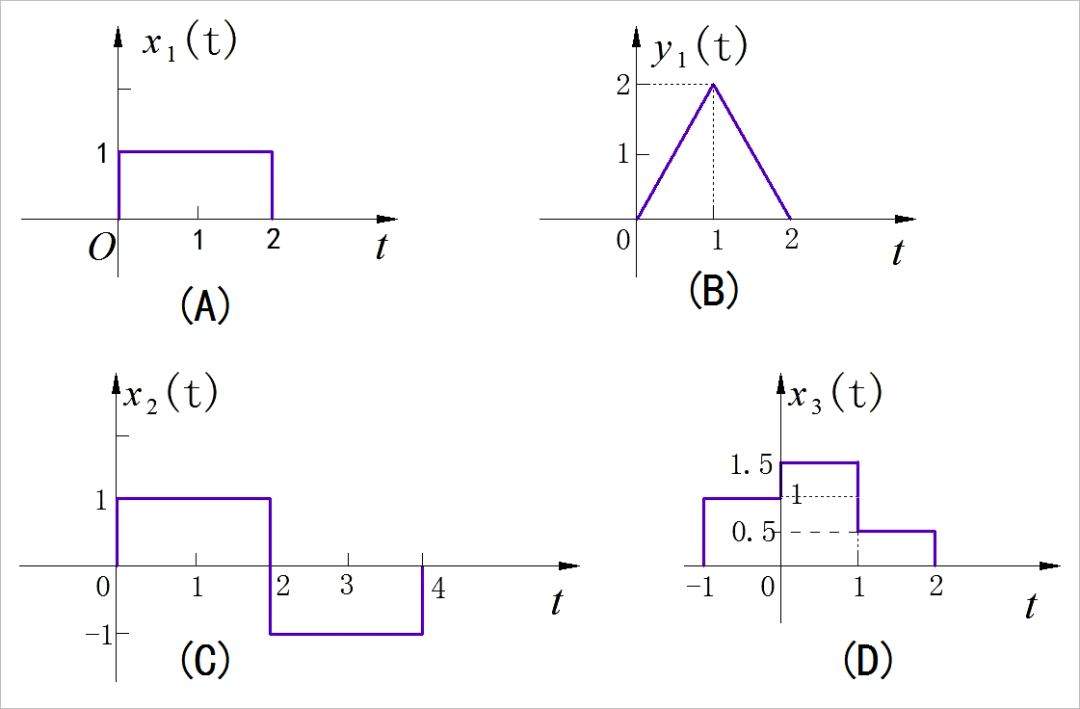
▲ 图1.4.1 LTI 系统输入输出信号提示:利用线性时不变系统特性求解此题。将新的输入信号 分别表示成 与其时移信号的线性组合, 然后在根据 LTI 特性, 对应系统输出可以使用 和它的延时信号进行线组合而得。
◎ 求解:
对于信号 可以由 表示成:
所以对应的输出对应的信号波形为:
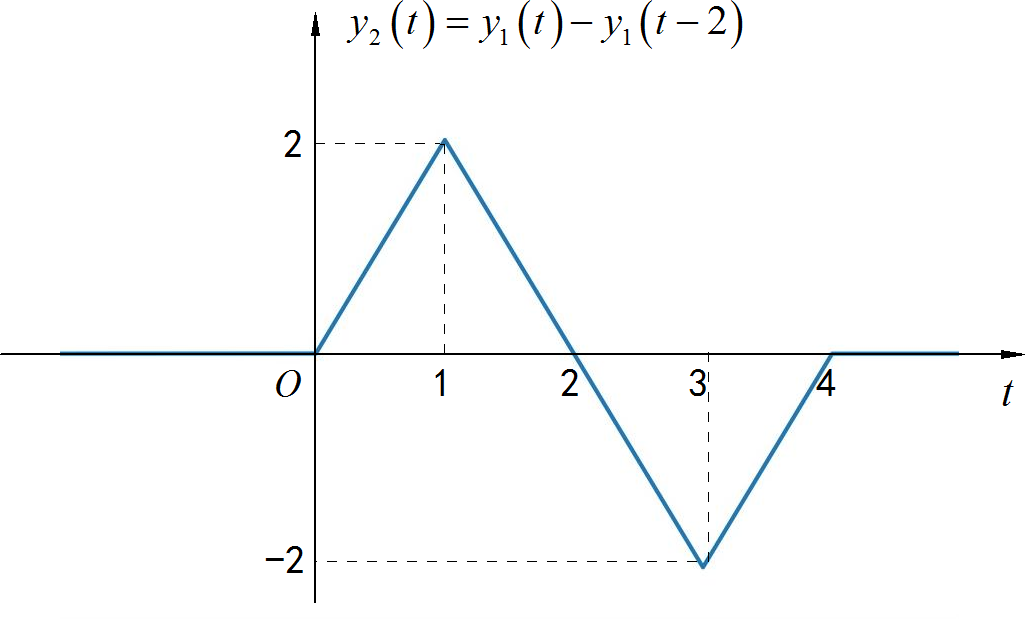
▲ 图1.4.2 信号波形对于信号 可以由 表示成:
那么对应的系统输出对应的信号波形:

▲ 图1.4.3 信号波形判断下列系统是否可逆。如果可逆则给出对应的逆系统。如果不可逆, 则给出两个不同的输入信号,他们所引起系统的输出是相同的。
题目中, 输入信号为 , 输出信号为 。
(1)

(2)
(3)
(4)
◎ 求解:
(1) 系统可逆, 逆系统为:
(2) 系统可逆, 逆系统为:
(3) 系统可逆, 逆系统为:
(4) 系统可逆, 逆系统为:
讨论下面电路输入输出之间是陈本可逆?
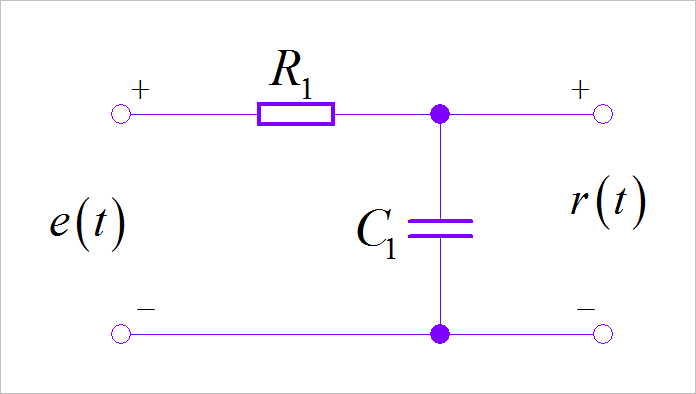
▲ 图1.5.1 低通滤波电路
▲ 图1.6.1 RC低通滤波器的逆系统注意,上述电路最后还需要再经过一级的反向,才真正实现将原始信号进行恢复。
参考文献: Inverse Analog Filter:History, Progress and Unresolved Issues[4]
相关讨论:Low Pass Filter Inverse[5]
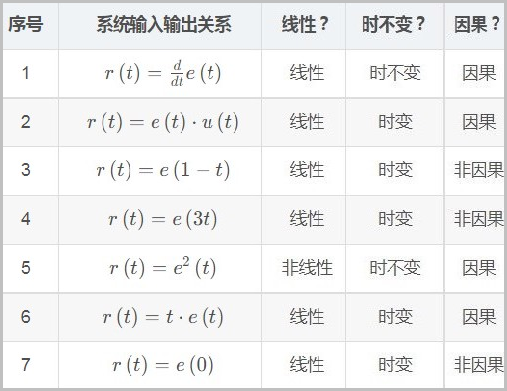
根据下面表格描述系统的输入输出关系表达式, 分别判断系统的线性、时不变、因果 特性。
◎ 求解:
已知三个离散时间系统的输入输出关系分别为:

注: 第一个系统是补零扩充 操作。
将上述三个子系统进行串联,如图所示。判断串联后的系统是否为线性、时不变系统?

▲ 图1.6.1 三个子系统串联在一起640延伸讨论:
如果将上面各子系统都修改成连续时间系统, 那么系统是否为线性时不变系统? 如果将上述各子系统交换串联顺序, 系统是否为线性时不变系统?
根据系统1、系统2特性,可以知道系统2 的输出为:

再根据系统3的特性,可以知道系统输出
该系统为线性、时不变。如果将上述子系统更换成连续时间系统,即

系统的输入输出关系为

如果将上述各子系统进行交换顺序,比如交换系统1和系统3, 则系统就会变成时变系统。
信号与系统 2023(春季) 作业要求 - 第二次作业: https://zhuoqing.blog.csdn.net/article/details/129301254
[2]信号与系统分析2022春季作业-参考答案:第二次作业: https://blog.csdn.net/zhuoqingjoking97298/article/details/124272216
[3]RC低通滤波器的逆系统: https://zhuoqing.blog.csdn.net/article/details/124342292
[4]Inverse Analog Filter:History, Progress and Unresolved Issues: https://www.mdpi.com/2079-9292/11/6/841/pdf
[5]Low Pass Filter Inverse: https://electronics.stackexchange.com/questions/273756/low-pass-filter-inverse