

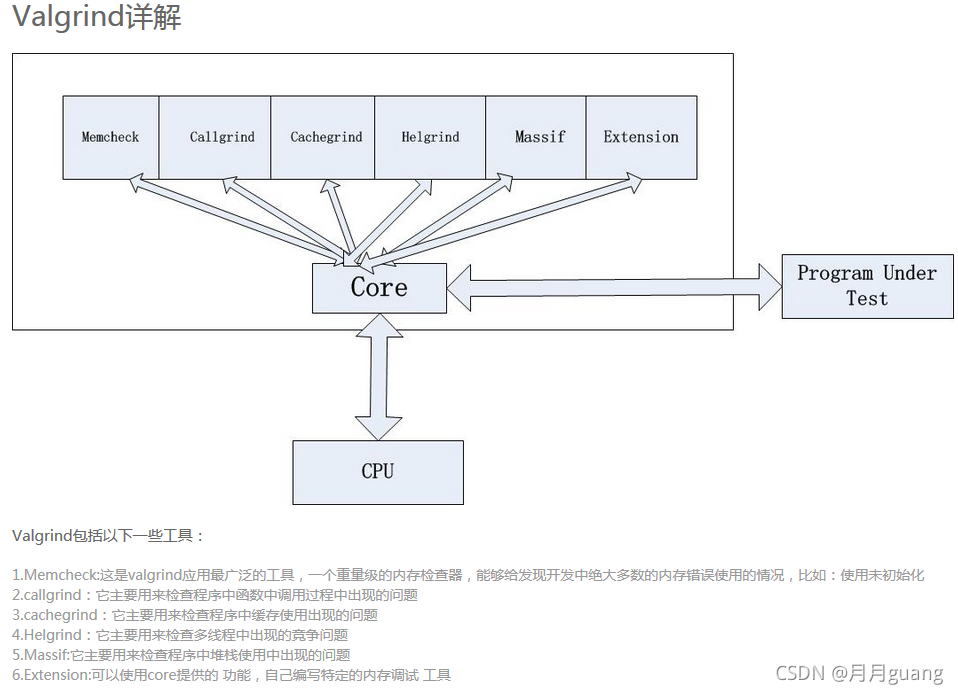
Valgrind是用于构建动态分析工具的装备性框架。它包括一个工具集,每个工具执行某种类型的调试、分析或类似的任务,以帮助完善你的程序。Valgrind的架构是模块化的,所以可以容易的创建新的工具而又不会扰乱现有的结构。
典型情况下,Valgrind会提供如下一系列的有用工具:
Memcheck 是一个内存错误侦测器。它有助于使你的程序,尤其是那些采用C或C 来写的程序,更加准确;
Cachegrind 是一个缓存和分支预测分析器。其有助于你提高程序的运行性能;
Callgrind 是一个调用图缓存生成分析器。它与Cachegrind的功能有重叠,但是也收集Cachegrind不收集的一些信息;
Helgrind 是一个线程错误检测器。它有助于使你的多线程程序更加准确;
DRD 也是一个线程错误检测器。它和Helgrind相似,但使用不同的分析技术,所以可能找到不同的问题;
Massif 是一个堆分析器。它有助于使你的程序使用更少的内存;
DHAT 是另一种不同的堆分析器。它有助于理解块(block)的生命周期、块的使用和布局的低效等问题;
SGcheck 是一个仍处于试验状态的工具,用来检测堆和全局数组的溢出。它的功能和Memcheck互补:SGcheck能找到一些Memcheck无法找到的问题,反之亦然;
BBV 是一个仍处于试验状态的SimPoint基本款矢量生成器。它对于进行计算机架构的研究和开发很有用处。
另外,也有一些大多数用户不会用到的小工具: Lackey是一个示例工具,用于演示一些装备的基础性内容;Nulgrind是一个最小化的Valgrind工具,不做分析或者操作,仅用于测试目的。
1) Memcheck
最常用的工具,用来检测程序中出现的内存问题,所有对内存的读写都会被检测到,一切对malloc、free、new、delete的调用都会被捕获。所以,它能检测以下问题:
1. 对未初始化内存的使用;
2. 读/写释放后的内存块;
3. 读/写超出malloc分配的内存块;
4. 读/写不适当的栈中内存块;
5. 内存泄露,指向一块内存的指针永远丢失;
6. 不正确的malloc/free或者new/delete匹配;
7. memcpy()相关函数中的dst和src指针重叠;
这些问题往往是C/C 程序员最头疼的问题,Memcheck能在这里帮上大忙。
2) Callgrind
和gprof类似的分析工具,但它对程序的运行观察更为入微,能给我们提供更多的信息。和gprof不同的是,它不需要在编译源代码时附加特殊选项,但还是推荐加上调试选项。Callgrind收集程序运行时的一些数据,建立函数调用关系图,还可以有选择地进行cache模拟。在运行结束时,它会把分析数据写入一个文件。callgrind_annotate可以把这个文件的内容转化成可读的形式。
3) Cachegrind
Cache分析器,它模拟CPU中的一级缓存和二级缓存,能够精确地指出程序中cache的丢失和命中。如果需要,它还能够为我们提供cache丢失次数,内存引用次数,以及每行代码,每个函数,每个模块,整个程序产生的指令数。这对优化程序有很大的帮助。
做一下广告:valgrind自身利用该工具在过去几个月使性能提高了25%~30%。据早先报道, kde的开发team也对valgrind在提高kde性能方面的帮助表示感谢。
4) Helgrind
它主要用来检查多线程程序中出现的竞争问题。Helgrind寻找内存中被多个线程访问,而又没有一贯加锁的区域,这些区域往往是线程之间失去同步的地方,而且会导致难以发觉的错误。Helgrind实现了名为Eraser的竞争检测算法,并做了进一步改进,减少了报告错误的次数。不过,Helgrind仍然处于实验状态。
5) Massif
堆栈分析器,它能测量程序在堆栈中使用了多少内存,告诉我们堆块,堆管理块和栈的大小。Massif能帮助我们减少内存的使用,在带有虚拟内存的现代系统中,它还能够加速我们程序的运行,减少程序停留在交换区中的几率。
Massif对内存的分配和释放做profile。程序开发者通过它可以深入了解程序的内存使用行为,从而对内存使用进行优化。这个功能对C 尤其有用,因为C 有很多隐藏的内存分配和释放。
# yum search valgrind Loaded plugins: fastestmirror, langpacks Loading mirror speeds from cached hostfile * base: mirrors.aliyun.com * extras: mirrors.aliyun.com * updates: mirrors.aliyun.com ==================== N/S matched: valgrind ======================================== valgrind-devel.i686 : Development files for valgrind valgrind-devel.x86_64 : Development files for valgrind valgrind-openmpi.x86_64 : OpenMPI support for valgrind valgrind.i686 : Tool for finding memory management bugs in programs valgrind.x86_64 : Tool for finding memory management bugs in programs Name and summary matches only, use "search all" for everything. # yum install valgrind
安装所需依赖
# yum install autoconf # yum install automake
下载安装包(官网下载地址)
# mkdir valgrind-inst
# cd valgrind-intst/
# wget http://www.valgrind.org/downloads/valgrind-3.14.0.tar.bz2
# ls
valgrind-3.14.0.tar.bz2
安装valgrind
# tar -jxvf valgrind-3.14.0.tar.bz2 # cd valgrind-3.14.0 # ./autogen.sh running: aclocal running: autoheader running: automake -a running: autoconf # ./configure # make # make install # valgrind --version valgrind-3.14.0 # which valgrind /usr/local/bin/valgrind
valgrind的基本使用格式如下:
valgrind [options] prog-and-args
其支持众多选项,我们可以通过valgrind --help来进行查看。这里我们只介绍几个较为常用的选项:
[options]
常用选项,适用于所有Valgrind工具
--tool=<name> 是最常用的选项,用于选择使用valgrind工具集中的哪一个工具,默认值为memcheck;
-v/--version 显示valgrind内核的版本,每个工具都有各自的版本;
-h/–help 显示帮助信息;
-q --quiet 安静的运行,只打印错误消息;
-v -–verbose 打印更详细的信息
--trace-children=no|yes 是否跟踪子进程,默认值为no;
--track-fds=no|yes 是否追踪打开的文件描述符,默认为no;
--time-stamp=no|yes 是否在打印出的每条消息之前加上时间戳信息,默认值为no
--log-fd=<number> 输出LOG到描述符文件 [2=stderr]
--log-file=<file> 指定将消息打印到某个文件
--log-file-exactly=<file> 输出LOG信息到 file
--log-file-qualifier=<VAR> 取得环境变量的值来做为输出信息的文件名,[none]
--log-socket=ipaddr:port 输出LOG到socket,ipaddr:port
LOG信息输出
--xml=yes 将信息以xml格式输出,只有memcheck可用
--num-callers=<number> show <number> callers in stack traces [12]
--error-limit=no|yes 如果太多错误,则停止显示新错误? [yes]
--error-exitcode=<number> 如果发现错误则返回错误代码 [0=disable]
--db-attach=no|yes 当出现错误,valgrind会自动启动调试器gdb。[no]
--db-command=<command> 启动调试器的命令行选项[gdb -nw %f %p]
适用于Memcheck工具的相关选项:
--leak-check=no|summary|full 在退出时是否查找内存泄露。默认值为summary
--leak-resolution=low|med|high how much bt merging in leak check [low]
--show-reachable=no|yes show reachable blocks in leak check? [no]
最常用的命令格式:
valgrind --tool=memcheck --leak-check=full ./test
这里我们主要讲述一下valgrind中memcheck工具的使用。该工具可以检测下列与内存相关的问题:
未初始化内存的使用;
对释放后内存的读/写;
对已分配内存块尾部的读/写;
内存泄露;
不匹配的使用malloc/free、new/delete、new[]/delete[]
重复释放内存
上面列出的并不是很全面,但却包含了能被该工具检测到的很多普遍问题。下面我们会一个个的对上面的场景进行讨论。
注意:下面讨论的所有测试代码在编译时最好都加上-g选项(用来在memcheck的输出中生成行号)进行编译。
1) 示例程序
#include <stdio.h>
#include <stdlib.h>

int main(void)
{
    char *p;

    char c = *p;

    printf("\n [%c]\n",c);

    return 0;
}
在上面的代码中,我们尝试使用未初始化的指针p。
2) 调试技巧
如下我们运行Memcheck来看下结果:
# gcc -g -c -o test.o test.c
# gcc -o test test.o

# valgrind --tool=memcheck ./test
==5918== Memcheck, a memory error detector
==5918== Copyright (C) 2002-2017, and GNU GPL'd, by Julian Seward et al.
==5918== Using Valgrind-3.14.0 and LibVEX; rerun with -h for copyright info
==5918== Command: ./test
==5918==
==5918== Use of uninitialised value of size 8
==5918==    at 0x400539: main (test.c:8)
==5918==
==5918== Invalid read of size 1
==5918==    at 0x400539: main (test.c:8)
==5918==  Address 0x0 is not stack'd, malloc'd or (recently) free'd
==5918==
==5918==
==5918== Process terminating with default action of signal 11 (SIGSEGV)
==5918==  Access not within mapped region at address 0x0
==5918==    at 0x400539: main (test.c:8)
==5918==  If you believe this happened as a result of a stack
==5918==  overflow in your program's main thread (unlikely but
==5918==  possible), you can try to increase the size of the
==5918==  main thread stack using the --main-stacksize= flag.
==5918==  The main thread stack size used in this run was 8388608.
==5918==
==5918== HEAP SUMMARY:
==5918==     in use at exit: 0 bytes in 0 blocks
==5918==   total heap usage: 0 allocs, 0 frees, 0 bytes allocated
==5918==
==5918== All heap blocks were freed -- no leaks are possible
==5918==
==5918== For counts of detected and suppressed errors, rerun with: -v
==5918== Use --track-origins=yes to see where uninitialised values come from
==5918== ERROR SUMMARY: 2 errors from 2 contexts (suppressed: 0 from 0)
Segmentation fault (core dumped)
从上面的输出可以看到,valgrind检测到了未初始化的变量,然后给出了警告。
1) 示例程序
#include <stdio.h>
#include <stdlib.h>

int main(void)
{
    char *p = malloc(1);
    *p = 'a';

    char c = *p;

    printf("\n [%c]\n",c);

    free(p);
    c = *p;
    return 0;
}
上面的代码中,我们有一个释放了内存的指针p,然后我们又尝试利用指针获取值。
2) 调试技巧
如下我们运行memcheck来看一下Valgrind对这种情况是如何反应的:
# gcc -g -c -o test.o test.c
# gcc -o test test.o

# valgrind --tool=memcheck ./test
==6067== Memcheck, a memory error detector
==6067== Copyright (C) 2002-2017, and GNU GPL'd, by Julian Seward et al.
==6067== Using Valgrind-3.14.0 and LibVEX; rerun with -h for copyright info
==6067== Command: ./test
==6067==

 [a]
==6067== Invalid read of size 1
==6067==    at 0x400609: main (test.c:14)
==6067==  Address 0x51f6040 is 0 bytes inside a block of size 1 free'd
==6067==    at 0x4C28F7D: free (vg_replace_malloc.c:530)
==6067==    by 0x400604: main (test.c:13)
==6067==  Block was alloc'd at
==6067==    at 0x4C27E83: malloc (vg_replace_malloc.c:299)
==6067==    by 0x4005CE: main (test.c:6)
==6067==
==6067==
==6067== HEAP SUMMARY:
==6067==     in use at exit: 0 bytes in 0 blocks
==6067==   total heap usage: 1 allocs, 1 frees, 1 bytes allocated
==6067==
==6067== All heap blocks were freed -- no leaks are possible
==6067==
==6067== For counts of detected and suppressed errors, rerun with: -v
==6067== ERROR SUMMARY: 1 errors from 1 contexts (suppressed: 0 from 0)
从上面的输出内容可以看到,valgrind检测到了无效的读取操作,然后输出了警告 ‘Invalid read of size 1’。
1) 示例程序
#include <stdio.h>
#include <stdlib.h>

int main(void)
{
    char *p = malloc(1);
    *p = 'a';

    char c = *(p 1);

    printf("\n [%c]\n",c);

    free(p);
    return 0;
}
在上面的代码中,我们已经为p分配了一个字节的内存,但我们在将值读取到c中的时候使用的地址是p 1。
2) 调试技巧
现在我们使用Valgrind运行上面的代码:
# gcc -g -c -o test.o test.c
# gcc -o test test.o

# valgrind --tool=memcheck ./test
==6302== Memcheck, a memory error detector
==6302== Copyright (C) 2002-2017, and GNU GPL'd, by Julian Seward et al.
==6302== Using Valgrind-3.14.0 and LibVEX; rerun with -h for copyright info
==6302== Command: ./test
==6302==
==6302== Invalid read of size 1
==6302==    at 0x4005DE: main (test.c:9)
==6302==  Address 0x51f6041 is 0 bytes after a block of size 1 alloc'd
==6302==    at 0x4C27E83: malloc (vg_replace_malloc.c:299)
==6302==    by 0x4005CE: main (test.c:6)
==6302==

 []
==6302==
==6302== HEAP SUMMARY:
==6302==     in use at exit: 0 bytes in 0 blocks
==6302==   total heap usage: 1 allocs, 1 frees, 1 bytes allocated
==6302==
==6302== All heap blocks were freed -- no leaks are possible
==6302==
==6302== For counts of detected and suppressed errors, rerun with: -v
==6302== ERROR SUMMARY: 1 errors from 1 contexts (suppressed: 0 from 0)
同样,该工具在这种情况下也检测到了无效的读取操作。
1) 示例程序
#include <stdio.h>
#include <stdlib.h>

int main(void)
{
    char *p = malloc(1);
    *p = 'a';

    char c = *p;

    printf("\n [%c]\n",c);

    return 0;
}
在这次的代码中,我们申请了一个字节但是没有将它释放。现在让我们运行valgrind看看会发生什么。
2) 调试技巧
# valgrind --tool=memcheck ./test
==6376== Memcheck, a memory error detector
==6376== Copyright (C) 2002-2017, and GNU GPL'd, by Julian Seward et al.
==6376== Using Valgrind-3.14.0 and LibVEX; rerun with -h for copyright info
==6376== Command: ./test
==6376==

 [a]
==6376==
==6376== HEAP SUMMARY:
==6376==     in use at exit: 1 bytes in 1 blocks
==6376==   total heap usage: 1 allocs, 0 frees, 1 bytes allocated
==6376==
==6376== LEAK SUMMARY:
==6376==    definitely lost: 1 bytes in 1 blocks
==6376==    indirectly lost: 0 bytes in 0 blocks
==6376==      possibly lost: 0 bytes in 0 blocks
==6376==    still reachable: 0 bytes in 0 blocks
==6376==         suppressed: 0 bytes in 0 blocks
==6376== Rerun with --leak-check=full to see details of leaked memory
==6376==
==6376== For counts of detected and suppressed errors, rerun with: -v
==6376== ERROR SUMMARY: 0 errors from 0 contexts (suppressed: 0 from 0)
上面显示检测到了内存泄露。这里如果我们加上一个--leak-check=full选项的话,则可以看到更为详细的细节。
上面LEAK SUMMARY会打印5种不同的类型,这里我们简单介绍一下:
definitely lost: 明确丢失的内存。程序中存在内存泄露,应尽快修复。当程序结束时如果一块动态分配的内存没有被释放并且通过程序内的指针变量均无法访问这块内存则会报这个错误;
indirectly lost: 间接丢失。当使用了含有指针成员的类或结构体时可能会报这个错误。这类错误无需直接修复,它们总是与definitely lost一起出现,只要修复definitely lost即可。
possibly lost: 可能丢失。大多数情况下应视为与definitely lost一样需要尽快修复,除非你的程序让一个指针指向一块动态分配的内存(但不是这块内存的起始地址),然后通过运算得到这块内存的起始地址,再释放它。当程序结束时如果一块动态分配的内存没有被释放并且通过程序内的指针变量均无法访问这块内存的起始地址,但可以访问其中的某一部分数据,则会报这个错误。
stil reachable: 可以访问,未丢失但也未释放。如果程序是正常结束的,那么它可能不会造成程序崩溃,但长时间运行有可能耗尽系统资源。
1) 示例代码
#include <stdio.h>
#include <stdlib.h>
#include<iostream>

int main(int argc, char *argv[])
{
    char *p = (char *)malloc(1);
    *p = 'a';

    char c = *p;

    printf("\n [%c]\n", c);

    delete p;

    return 0x0;
}
上面的代码中,我们使用了malloc()来分配内存,但是使用了delete操作符来删除内存。
2) 调试技巧
# gcc -g -c -o test.o test.cpp
# gcc -o test test.o -lstdc

# valgrind --tool=memcheck ./test
==15237== Memcheck, a memory error detector
==15237== Copyright (C) 2002-2017, and GNU GPL'd, by Julian Seward et al.
==15237== Using Valgrind-3.14.0 and LibVEX; rerun with -h for copyright info
==15237== Command: ./test
==15237==

 [a]
==15237== Mismatched free() / delete / delete []
==15237==    at 0x4C2942D: operator delete(void*) (vg_replace_malloc.c:576)
==15237==    by 0x4007EB: main (test.cpp:14)
==15237==  Address 0x5a15040 is 0 bytes inside a block of size 1 alloc'd
==15237==    at 0x4C27E83: malloc (vg_replace_malloc.c:299)
==15237==    by 0x4007B5: main (test.cpp:7)
==15237==
==15237==
==15237== HEAP SUMMARY:
==15237==     in use at exit: 0 bytes in 0 blocks
==15237==   total heap usage: 1 allocs, 1 frees, 1 bytes allocated
==15237==
==15237== All heap blocks were freed -- no leaks are possible
==15237==
==15237== For counts of detected and suppressed errors, rerun with: -v
==15237== ERROR SUMMARY: 1 errors from 1 contexts (suppressed: 0 from 0)
从上面的输出可以看到,valgrind清楚的说明了 ‘Mismatched free() / delete / delete[] ‘
1) 代码示例
#include <stdio.h>
#include <stdlib.h>

int main(int argc, char *argv[])
{
    char *p = (char *)malloc(1);
    *p = 'a';

    char c = *p;
    printf("\n [%c]\n",c);
    free(p);
    free(p);
    return 0;
}
2) 调试技巧
在上面的代码中,我们两次释放了p指向的内存,现在让我们运行memcheck:
# gcc -g -c -o test.o test.c
# gcc -o test test.o

# valgrind --tool=memcheck ./test
==15354== Memcheck, a memory error detector
==15354== Copyright (C) 2002-2017, and GNU GPL'd, by Julian Seward et al.
==15354== Using Valgrind-3.14.0 and LibVEX; rerun with -h for copyright info
==15354== Command: ./test
==15354==

 [a]
==15354== Invalid free() / delete / delete[] / realloc()
==15354==    at 0x4C28F7D: free (vg_replace_malloc.c:530)
==15354==    by 0x400617: main (test.c:12)
==15354==  Address 0x51f6040 is 0 bytes inside a block of size 1 free'd
==15354==    at 0x4C28F7D: free (vg_replace_malloc.c:530)
==15354==    by 0x40060B: main (test.c:11)
==15354==  Block was alloc'd at
==15354==    at 0x4C27E83: malloc (vg_replace_malloc.c:299)
==15354==    by 0x4005D5: main (test.c:6)
==15354==
==15354==
==15354== HEAP SUMMARY:
==15354==     in use at exit: 0 bytes in 0 blocks
==15354==   total heap usage: 1 allocs, 2 frees, 1 bytes allocated
==15354==
==15354== All heap blocks were freed -- no leaks are possible
==15354==
==15354== For counts of detected and suppressed errors, rerun with: -v
==15354== ERROR SUMMARY: 1 errors from 1 contexts (suppressed: 0 from 0)
从上面的输出可以看到,该功能检测到我们对同一个指针调用了两次释放内存操作。
1) 示例程序
#include <stdio.h>
#include <stdlib.h>

class c1
{
private:
    char *m_pcData;


public:
    c1();
    ~c1();
};


c1::c1()
{
    m_pcData=(char*)malloc(10);
}


c1::~c1()
{
    if(m_pcData) delete m_pcData;
}

char *Fun1()//definitely lost
{
    char *pcTemp;


    pcTemp=(char*)malloc(10);
    return pcTemp;
}


char *Fun2()//still reachable
{
    static char *s_pcTemp=NULL;


    if(s_pcTemp==NULL) s_pcTemp=(char*)malloc(10);


    return NULL;
}


char *Fun3()//possibly lost
{
    static char *s_pcTemp;
    char *pcData;


    pcData=(char*)malloc(10);
    s_pcTemp=pcData 1;


    return NULL;
}


int Fun4()//definitely and indirectly lost
{
    c1 *pobjTest;


    pobjTest=new c1();


    return 0;
}


char *Fun5()//possibly lost but no need of repair,repair the breakdown then no memory leak
{
    char *pcData;
    int i,*piTemp=NULL;


    pcData=(char*)malloc(10);
    pcData =10;
    for(i=0;i<10;i  )
    {
        pcData--;
        *pcData=0;

        if(i==5) *piTemp=1;//create a breakdown
    }
    free(pcData);


    return NULL;
}


int main(int argc, char *argv[])
{
    printf("This program will create various memory leak,use valgrind to observe it.\n");
    printf("Following functions are bad codes,don\'t imitate.\n");
    printf("Fun1\n");
    Fun1();
    printf("Fun2\n");
    Fun2();
    printf("Fun3\n");
    Fun3();
    printf("Fun4\n");
    Fun4();
    printf("Fun5\n");
    Fun5();
    printf("end\n");


    return 0;
}
2) 调试技巧
# gcc -g -c -o test.o test.cpp
# gcc -o test test.o -lstdc
# valgrind --tool=memcheck ./test
==15596== Memcheck, a memory error detector
==15596== Copyright (C) 2002-2017, and GNU GPL'd, by Julian Seward et al.
==15596== Using Valgrind-3.14.0 and LibVEX; rerun with -h for copyright info
==15596== Command: ./test
==15596==
This program will create various memory leak,use valgrind to observe it.
Following functions are bad codes,don't imitate.
Fun1
Fun2
Fun3
Fun4
Fun5
==15596== Invalid write of size 4
==15596==    at 0x400859: Fun5() (test.cpp:88)
==15596==    by 0x4008E9: main (test.cpp:110)
==15596==  Address 0x0 is not stack'd, malloc'd or (recently) free'd
==15596==
==15596==
==15596== Process terminating with default action of signal 11 (SIGSEGV)
==15596==  Access not within mapped region at address 0x0
==15596==    at 0x400859: Fun5() (test.cpp:88)
==15596==    by 0x4008E9: main (test.cpp:110)
==15596==  If you believe this happened as a result of a stack
==15596==  overflow in your program's main thread (unlikely but
==15596==  possible), you can try to increase the size of the
==15596==  main thread stack using the --main-stacksize= flag.
==15596==  The main thread stack size used in this run was 8388608.
==15596==
==15596== HEAP SUMMARY:
==15596==     in use at exit: 58 bytes in 6 blocks
==15596==   total heap usage: 6 allocs, 0 frees, 58 bytes allocated
==15596==
==15596== LEAK SUMMARY:
==15596==    definitely lost: 18 bytes in 2 blocks
==15596==    indirectly lost: 10 bytes in 1 blocks
==15596==      possibly lost: 20 bytes in 2 blocks
==15596==    still reachable: 10 bytes in 1 blocks
==15596==         suppressed: 0 bytes in 0 blocks
==15596== Rerun with --leak-check=full to see details of leaked memory
==15596==
==15596== For counts of detected and suppressed errors, rerun with: -v
==15596== ERROR SUMMARY: 1 errors from 1 contexts (suppressed: 0 from 0)
Segmentation fault (core dumped)
[参看]
参考网站:
http://www.linuxidc.com/Linux/2012-06/63754.htm
http://elinux.org/Valgrind (wiki)
http://blog.csdn.net/sduliulun/article/details/7732906
http://blog.csdn.net/gatieme/article/details/51959654(比较全面的介绍)
http://www.linuxidc.com/Linux/2012-06/63754.htm (非常详细的介绍了每个工具的使用)
